One of the first things you learn in Technical Analysis is that markets are fractal.
The same emotions, behaviors, and patterns repeat themselves — whether you’re looking at a 5-minute chart or a multi-year one.
That’s the foundation of multiple timeframe analysis, and it’s something we lean on heavily at All Star Charts.
We always start at the top. Monthly and weekly charts define the primary trend and set the structural backdrop. That’s where the biggest opportunities reveal themselves.
Only after that work is done do we drop down to the daily timeframe to fine-tune entries and execute trades.
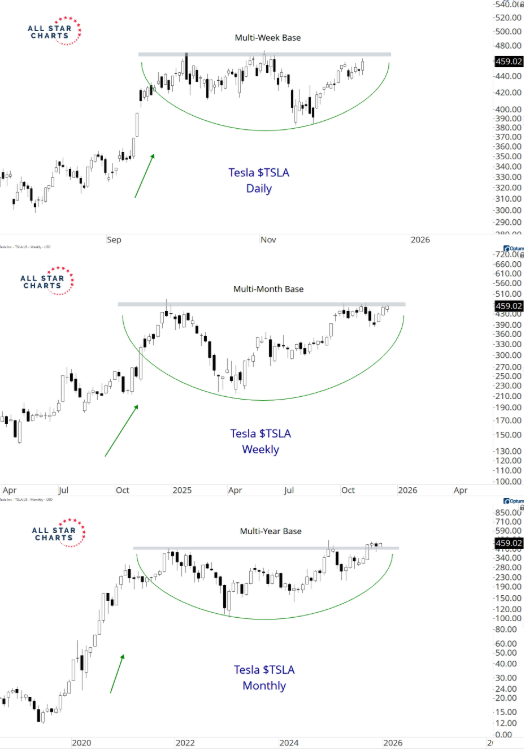
Tesla $TSLA is a textbook example of this process playing out right now.
A major base on the monthly, another resolving higher on the weekly, and now a fresh base tightening on the daily.
This is fractals in action.
When long-term, medium-term, and short-term charts all line up, it’s a strong clue that momentum is building and a bigger breakout could be coming.