Small-caps are currently experiencing their third-longest period without reaching all-time highs. So far, it has lasted 808 trading days, and they are still in a 6.7% drawdown.
Here’s the chart:
(right-click and open image in new tab to zoom in)
Let's break down what the chart shows:
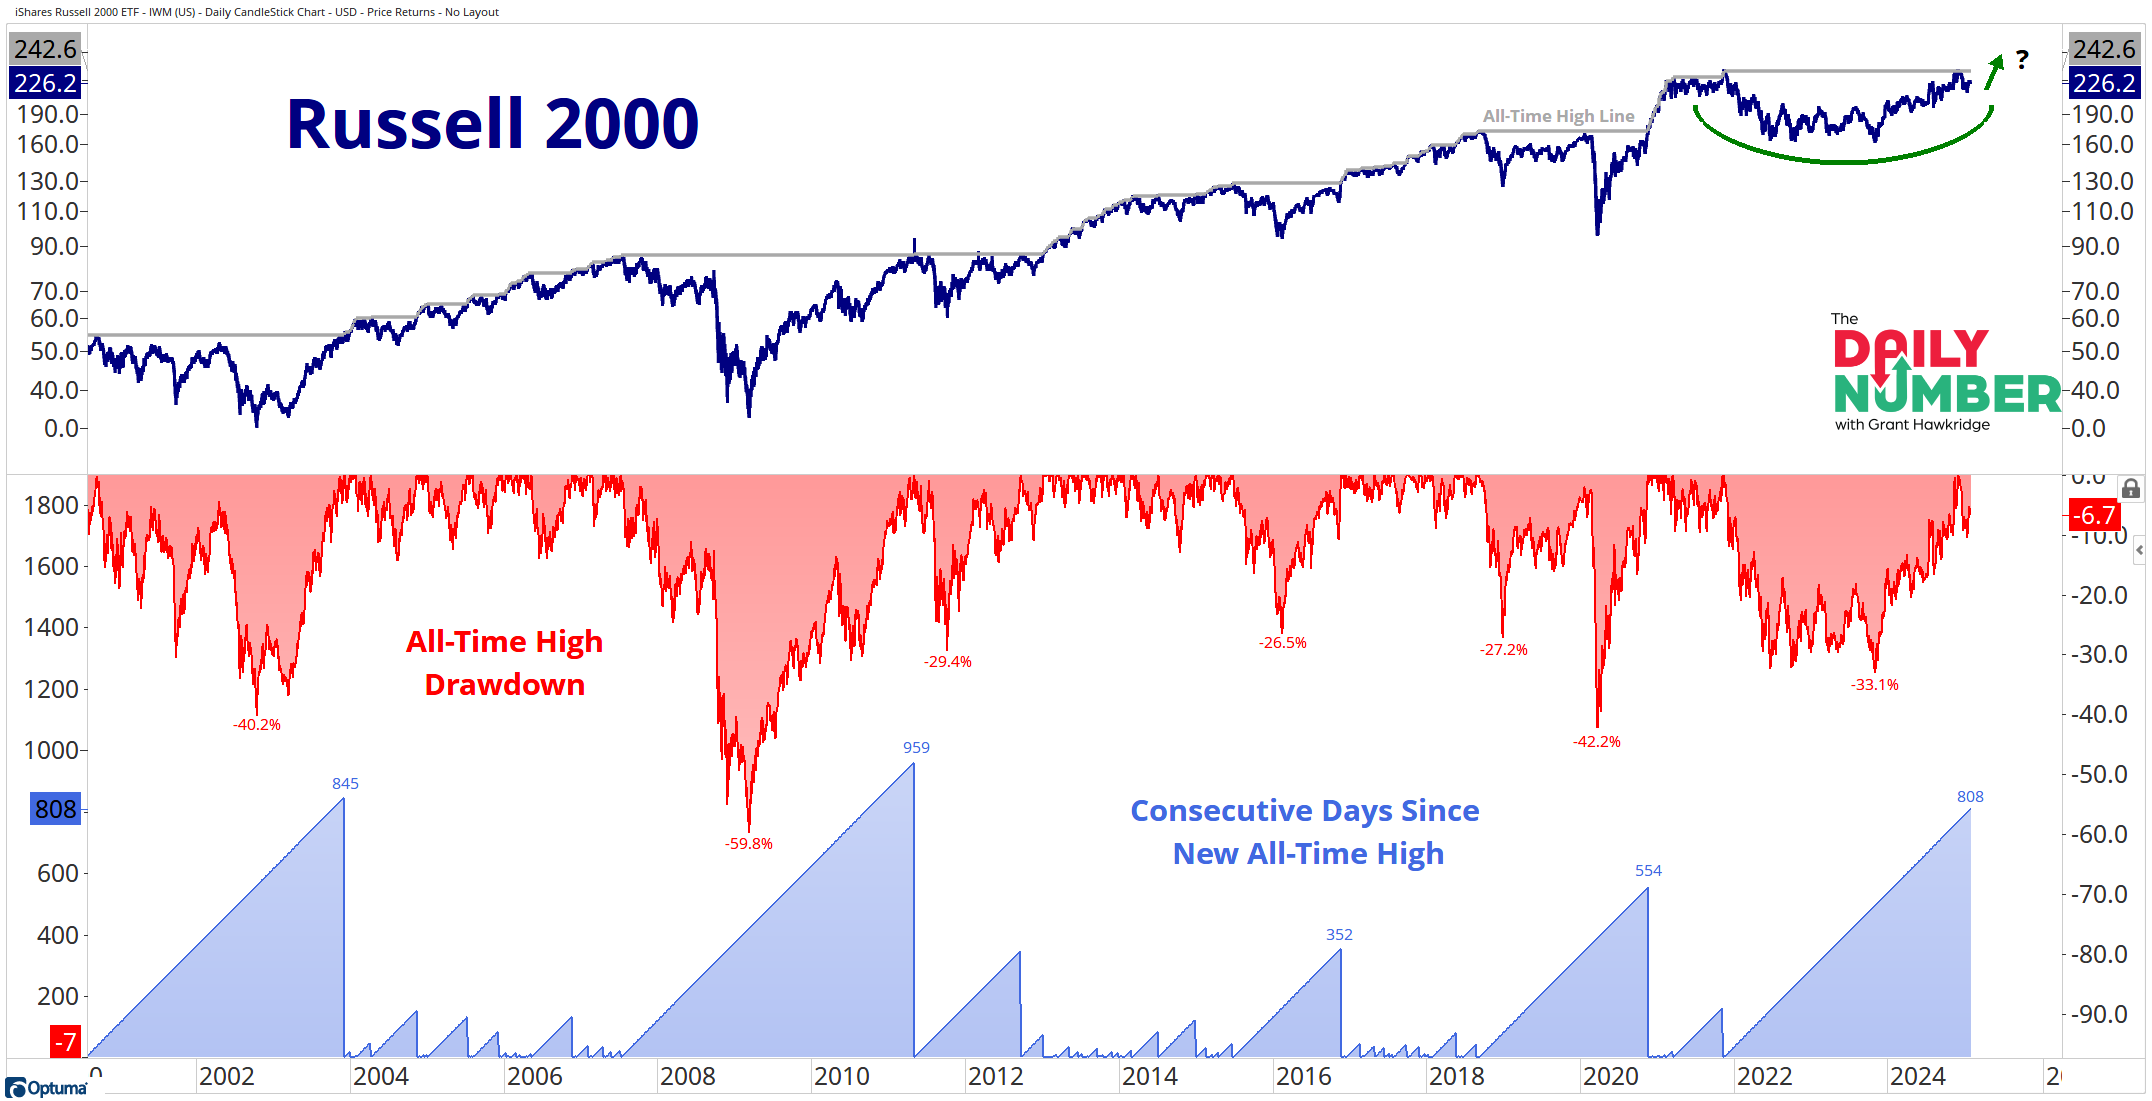
The dark blue line in the top is the S&P 500 index price.
The gray line in the top panel is the all-time high level.
The red line in the middle shows the all-time high drawdown in small caps.
The light blue line in the bottom shows the consecutive trading days since we last saw an all-time high in small caps.
The Takeaway: Is 2025 the year we see all-time highs in small caps? Maybe.
But right now, Small-caps are currently trading below their previous cycle highs from 2021 and have been for the past 808 trading days.
Small-cap stocks are often under-owned and underappreciated, leading to low overall expectations for the riskiest stocks in the market. By design, small-cap indexes regularly replace their best-performing stocks, which results in underperformance.
So does this current consolidation in small caps need to resolve higher for the overall bull market to continue?
Small-caps aren't required to outperform in order for the overall stock market to be in a healthy environment. However, a breakout of this three-year consolidation and a higher level of participation will be very supportive of the overall bull market's next leg higher.
If you find my content valuable, I would greatly appreciate it if you could share it with your friends, family, and colleagues. Your help in spreading the word is invaluable in supporting our work. Thank you to all of you who share!