The percentage of S&P 500 stocks reaching 12-month highs is now at its highest level since November of last year.
Here’s the chart:
(right-click and open image in new tab to zoom in)
Let's break down what the chart shows:
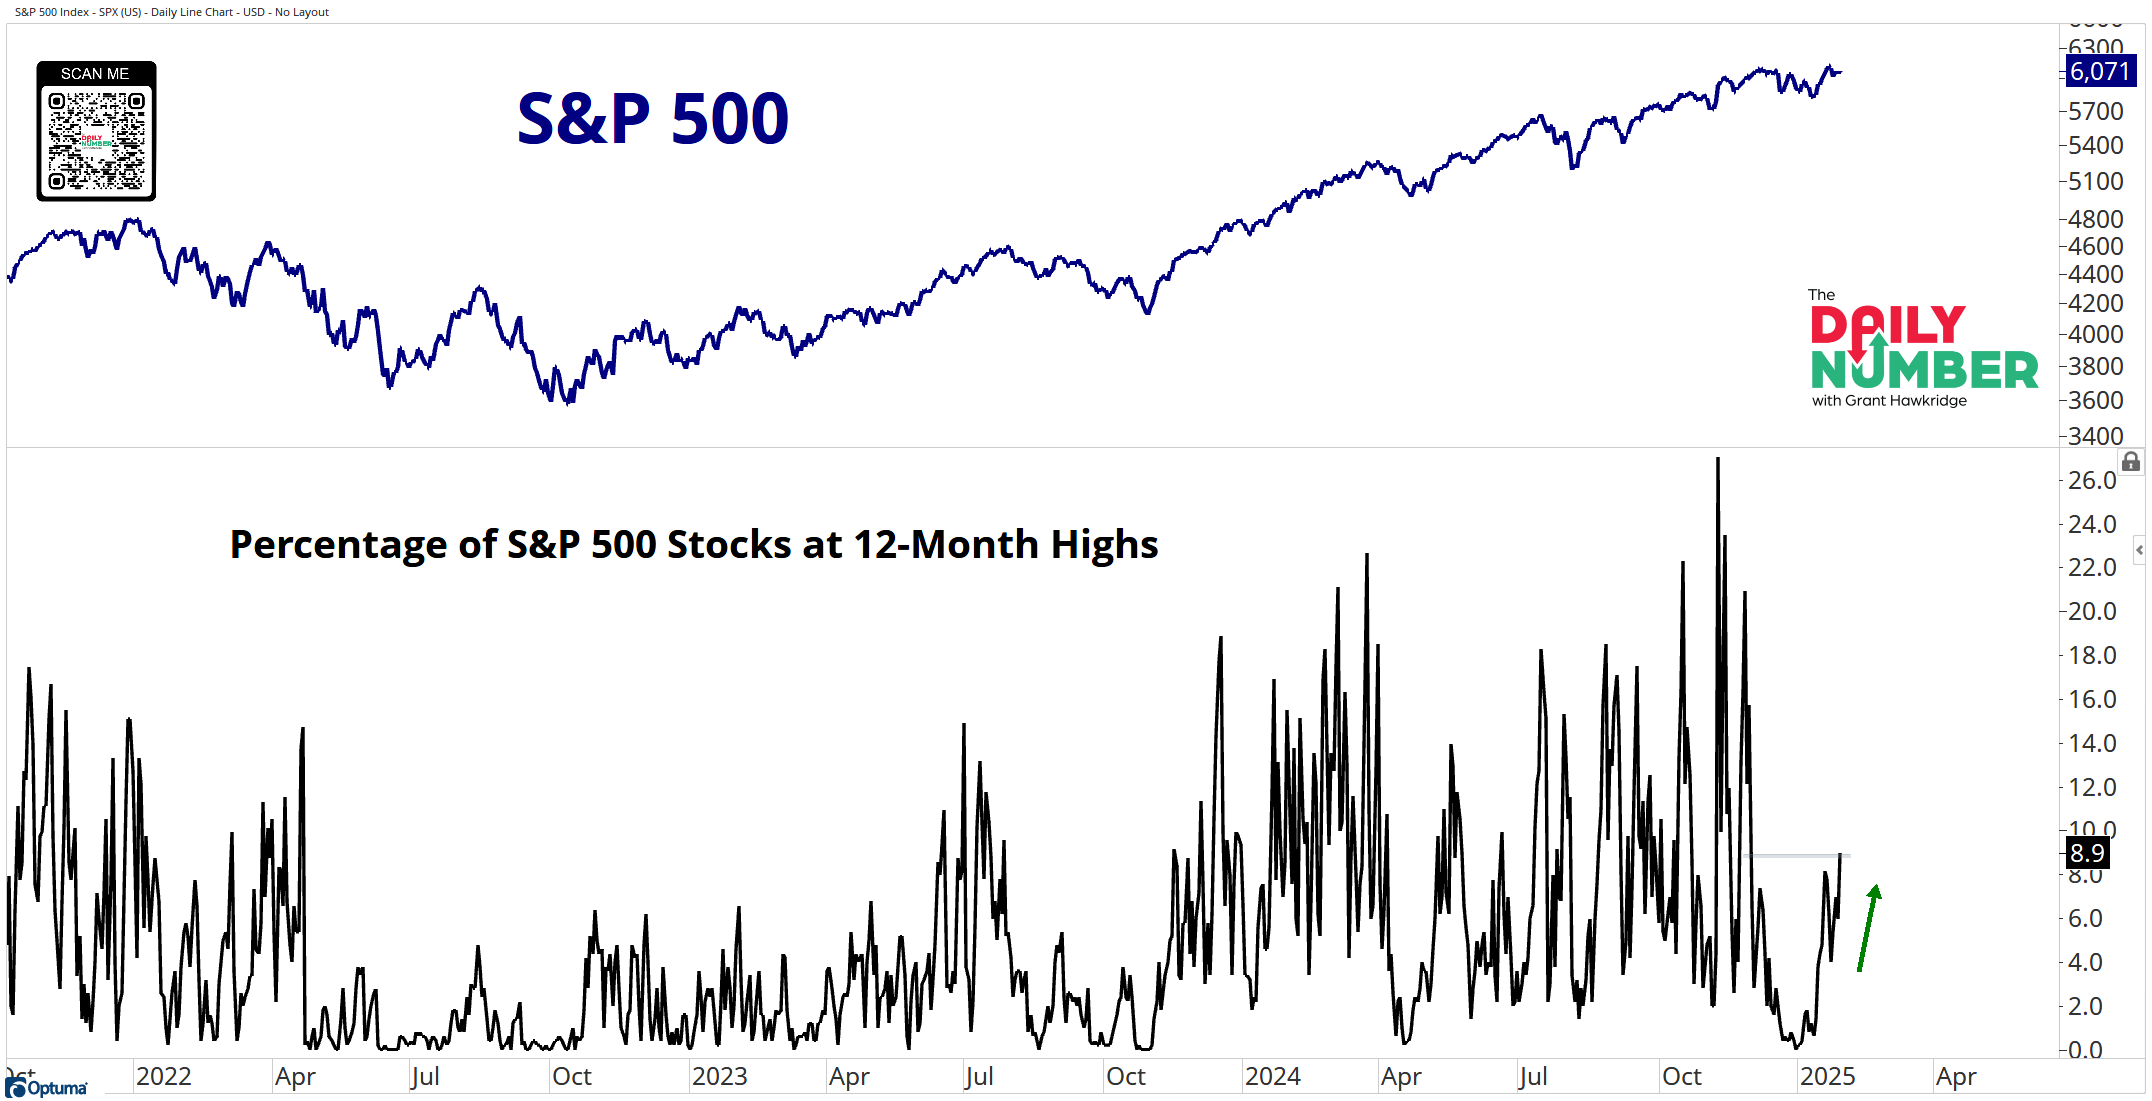
The blue line in the top panel is the S&P 500 index price.
The black line in the bottom panelshows the percentage of S&P 500 stocks making 12-month highs.
The Takeaway: Breadth continues to improve, although the S&P 500 is currently down 0.49% week-to-date, when you look under the hood, you can see that 12-month highs are expanding and have reached their highest level in over two months.
This is called participation… which is a necessary condition for any bull market, and the current bulls have consistently demonstrated their resilience and strength.
The stock market can only decline with an expansion in the new lows list, and the percentage of S&P 500 stocks hitting new lows across all time frames is virtually non-existent.
It's impossible for things to get worse if they continue to improve.
If you find my content valuable, I would greatly appreciate it if you could share it with your friends, family, and colleagues. Your help in spreading the word is invaluable in supporting our work. Thank you to all of you who share!