Let's check in on how the third year of this bull market is progressing.
Here’s the chart:
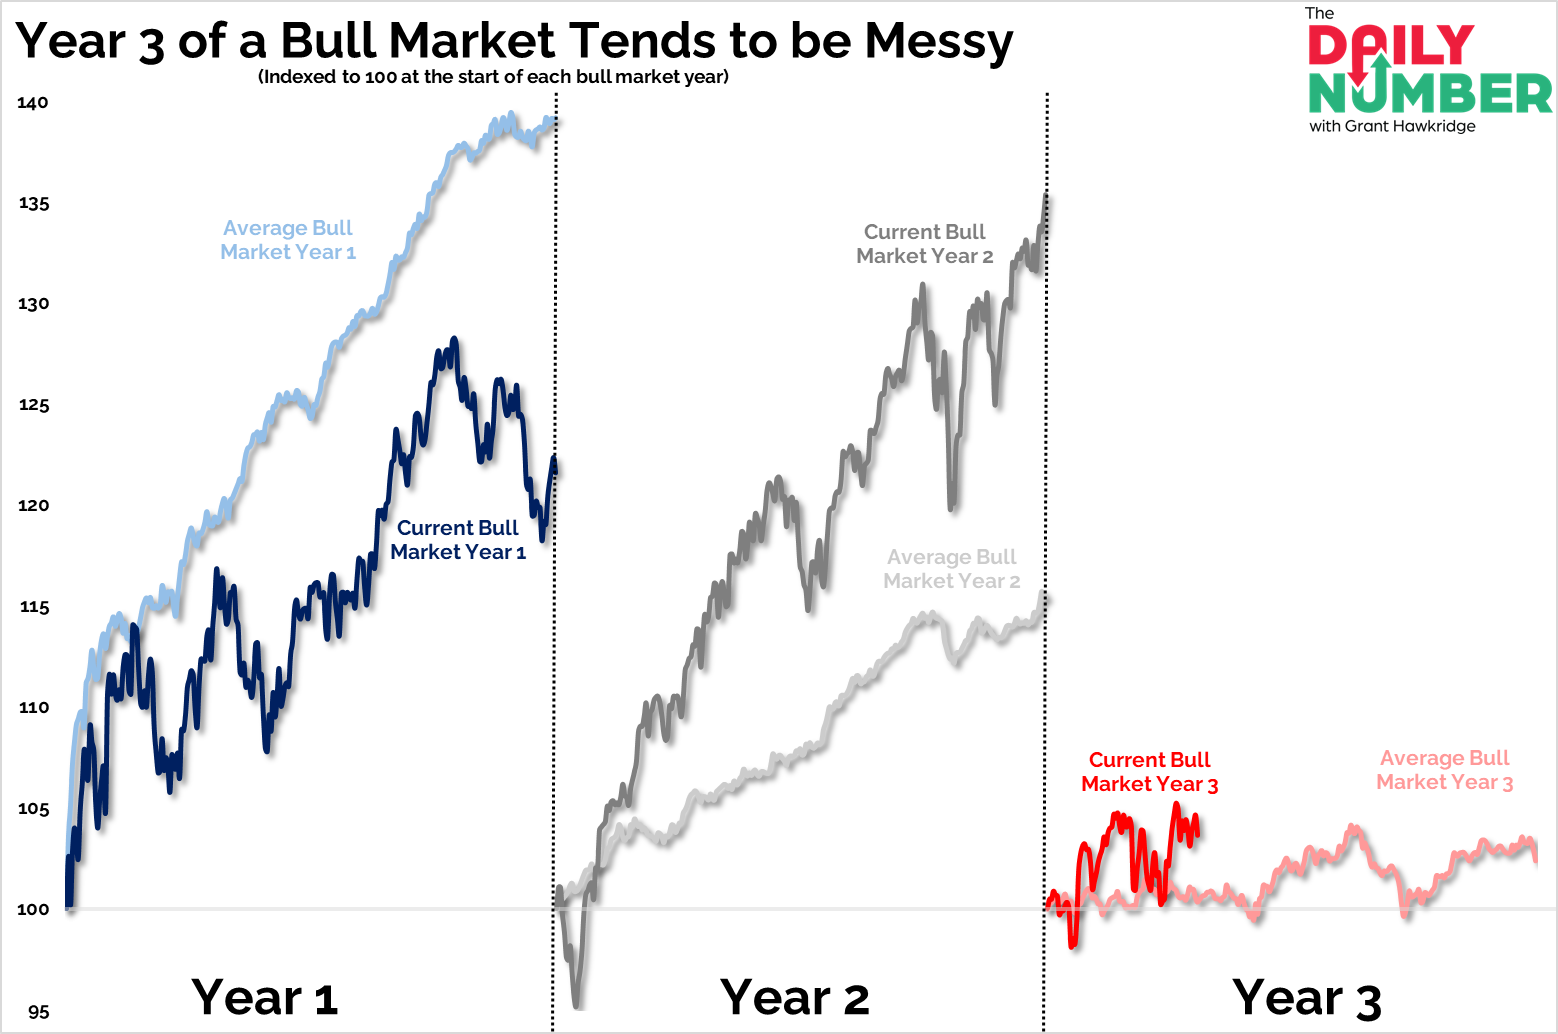
Let's break down what the chart shows:
The light blue line represents the performance of an average first year during a bull market for the S&P 500. The dark blue line illustrates the performance of the first year of the current bull market for the S&P 500.
The light gray line indicates the performance of an average second year within a bull market for the S&P 500, while the dark gray line shows the performance of the second year of the current bull market.
The light red line indicates the performance of an average third year during a bull market for the S&P 500, and the dark red line represents the performance of the third year of the current bull market for the S&P 500.
The Takeaway: Let's start by clarifying how I define a bull market:
A bull market is a 20% or more rally preceded by a -20% or more drop.
The current bull market has been ongoing for 581 trading days, resulting in a 69% gain. However, historically, after two years of strong market gains, the third year tends to be flat.
We are currently 78 trading days into the third year of this bull market, and it appears to be following its historical trend of remaining relatively flat during this period, as it has only gained just over 3% in four months.
As humans, we often repeat patterns. Could this serve as a playbook for 2025?
Year three might be a sideways grind before we begin to move higher in year 4.
If you find my content valuable, I would greatly appreciate it if you could share it with your friends, family, and colleagues. Your help in spreading the word is invaluable in supporting our work. Thank you to all of you who share!