Breadth levels you don't see during a bull market📉
April 15, 2025
Today's number is... 50%
More than 50% of stocks listed on the NYSE reached 52-week lows last week.
Here’s the chart:
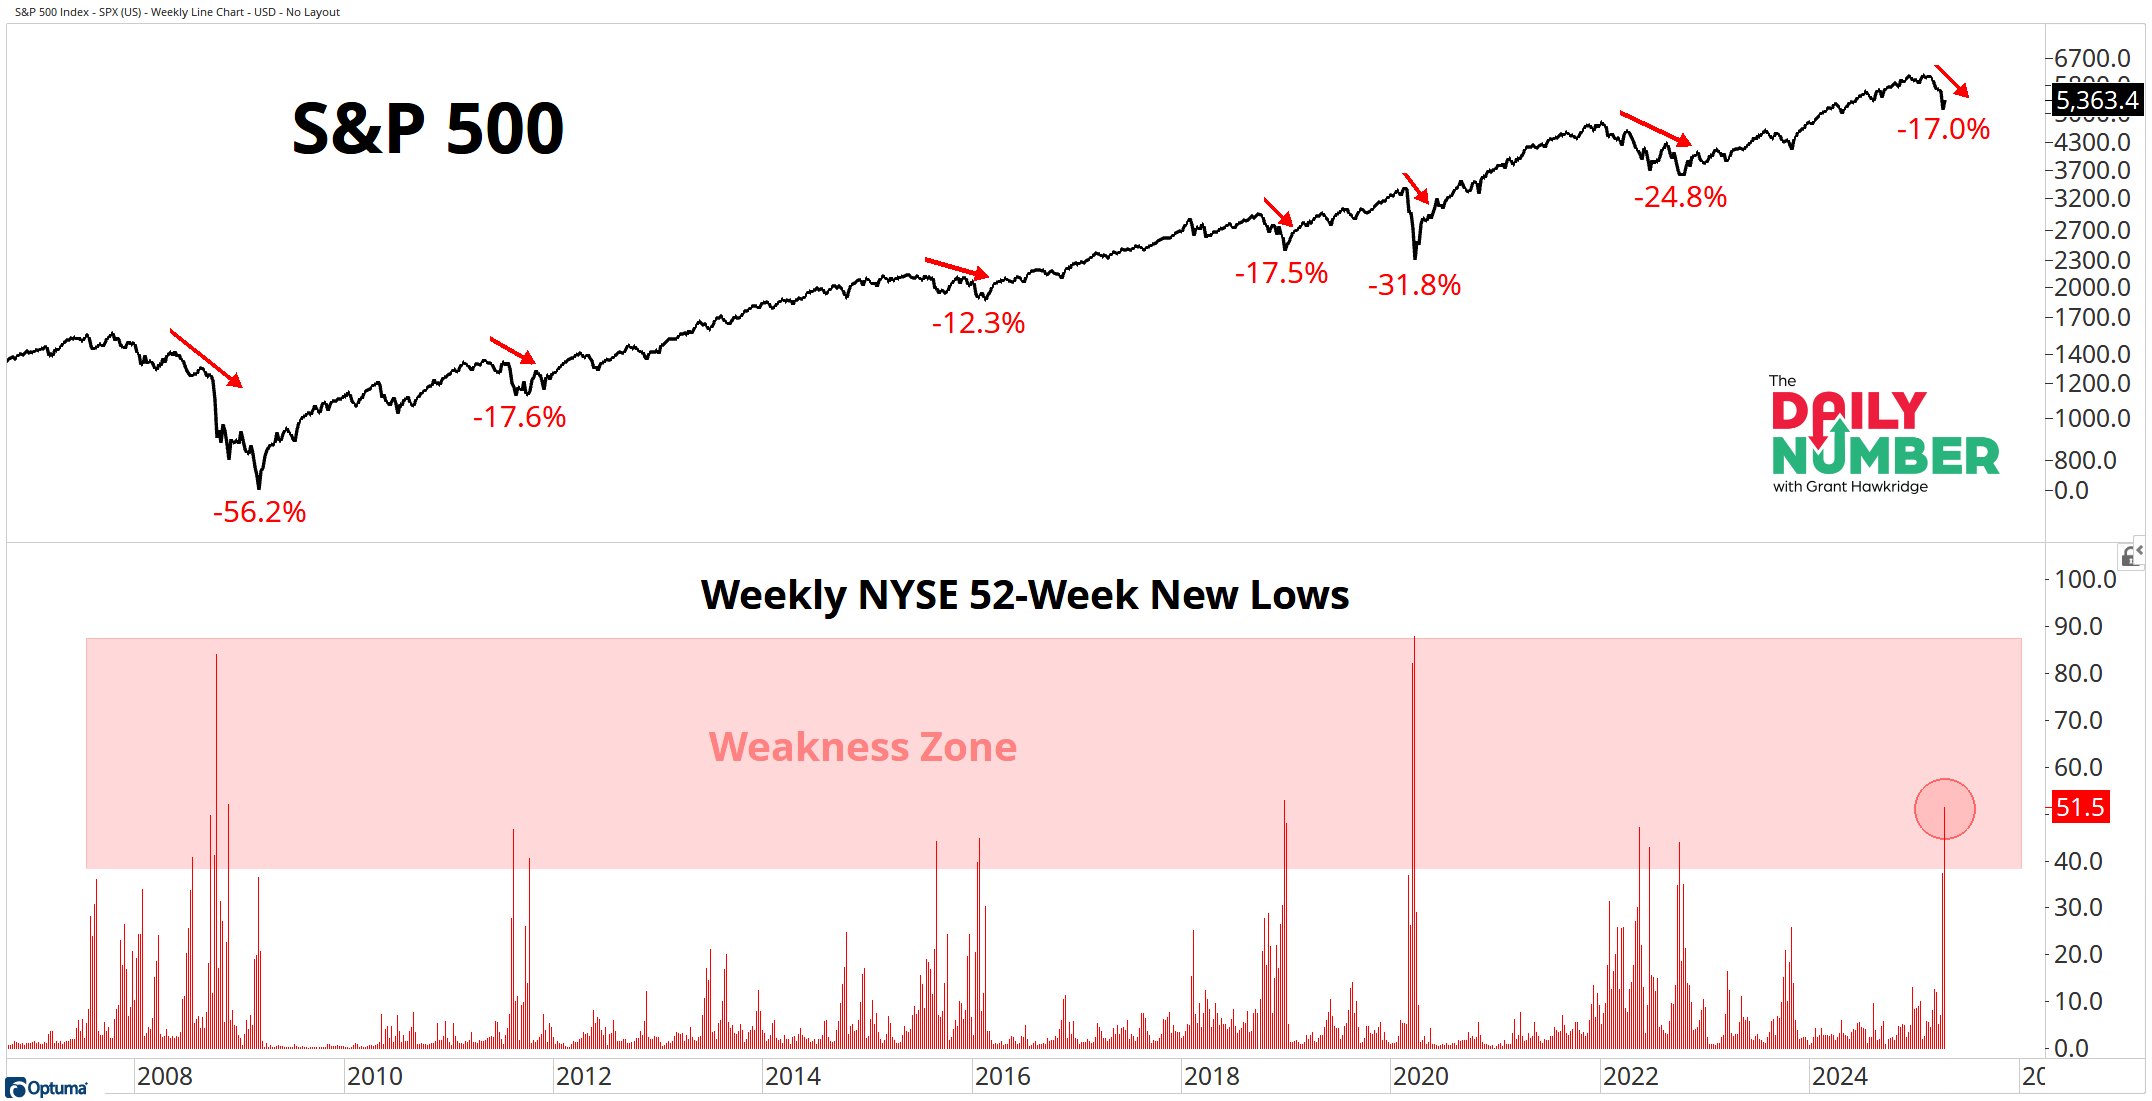
Let's break down what the chart shows:
The black line in the top panel is the S&P 500 index price.
The red lines in the bottom panelshow the percentage of NYSE stocks making 52-Week New Lows.
The Takeaway: The stock market can only decline with an expansion in the new lows list, it's simple math… and you know what… The number of stocks making new lows expanded to its fourth-highest level over the past 17 years.
That's expansion!
No two ways about it…
Last week, among the 2,862 stocks listed on the NYSE, 1,475 made new 52-week lows…
That's over half of the stocks that are listed on the NYSE exchange!
These are not levels you see during a bull market.
Moving forward from here, the Bulls must first stop stocks from declining. They have been trying to put something together, but have yet to show any type of back-to-back follow-through just yet.
Is there room for new lows to keep expanding? Absolutely.
Can the Bulls rebound from here? Of course.
However, when assessing the current situation using a weight of the evidence approach, it still tilts in favor of the bears.
Are you tightening your belt here? Or buying the dip?
If you find my content valuable, I would greatly appreciate it if you could share it with your friends, family, and colleagues. Your help in spreading the word is invaluable in supporting our work. Thank you to all of you who share!