My sentiment composite hits a fresh 16-month high.
Here’s the chart:
Let's break down what the chart shows:
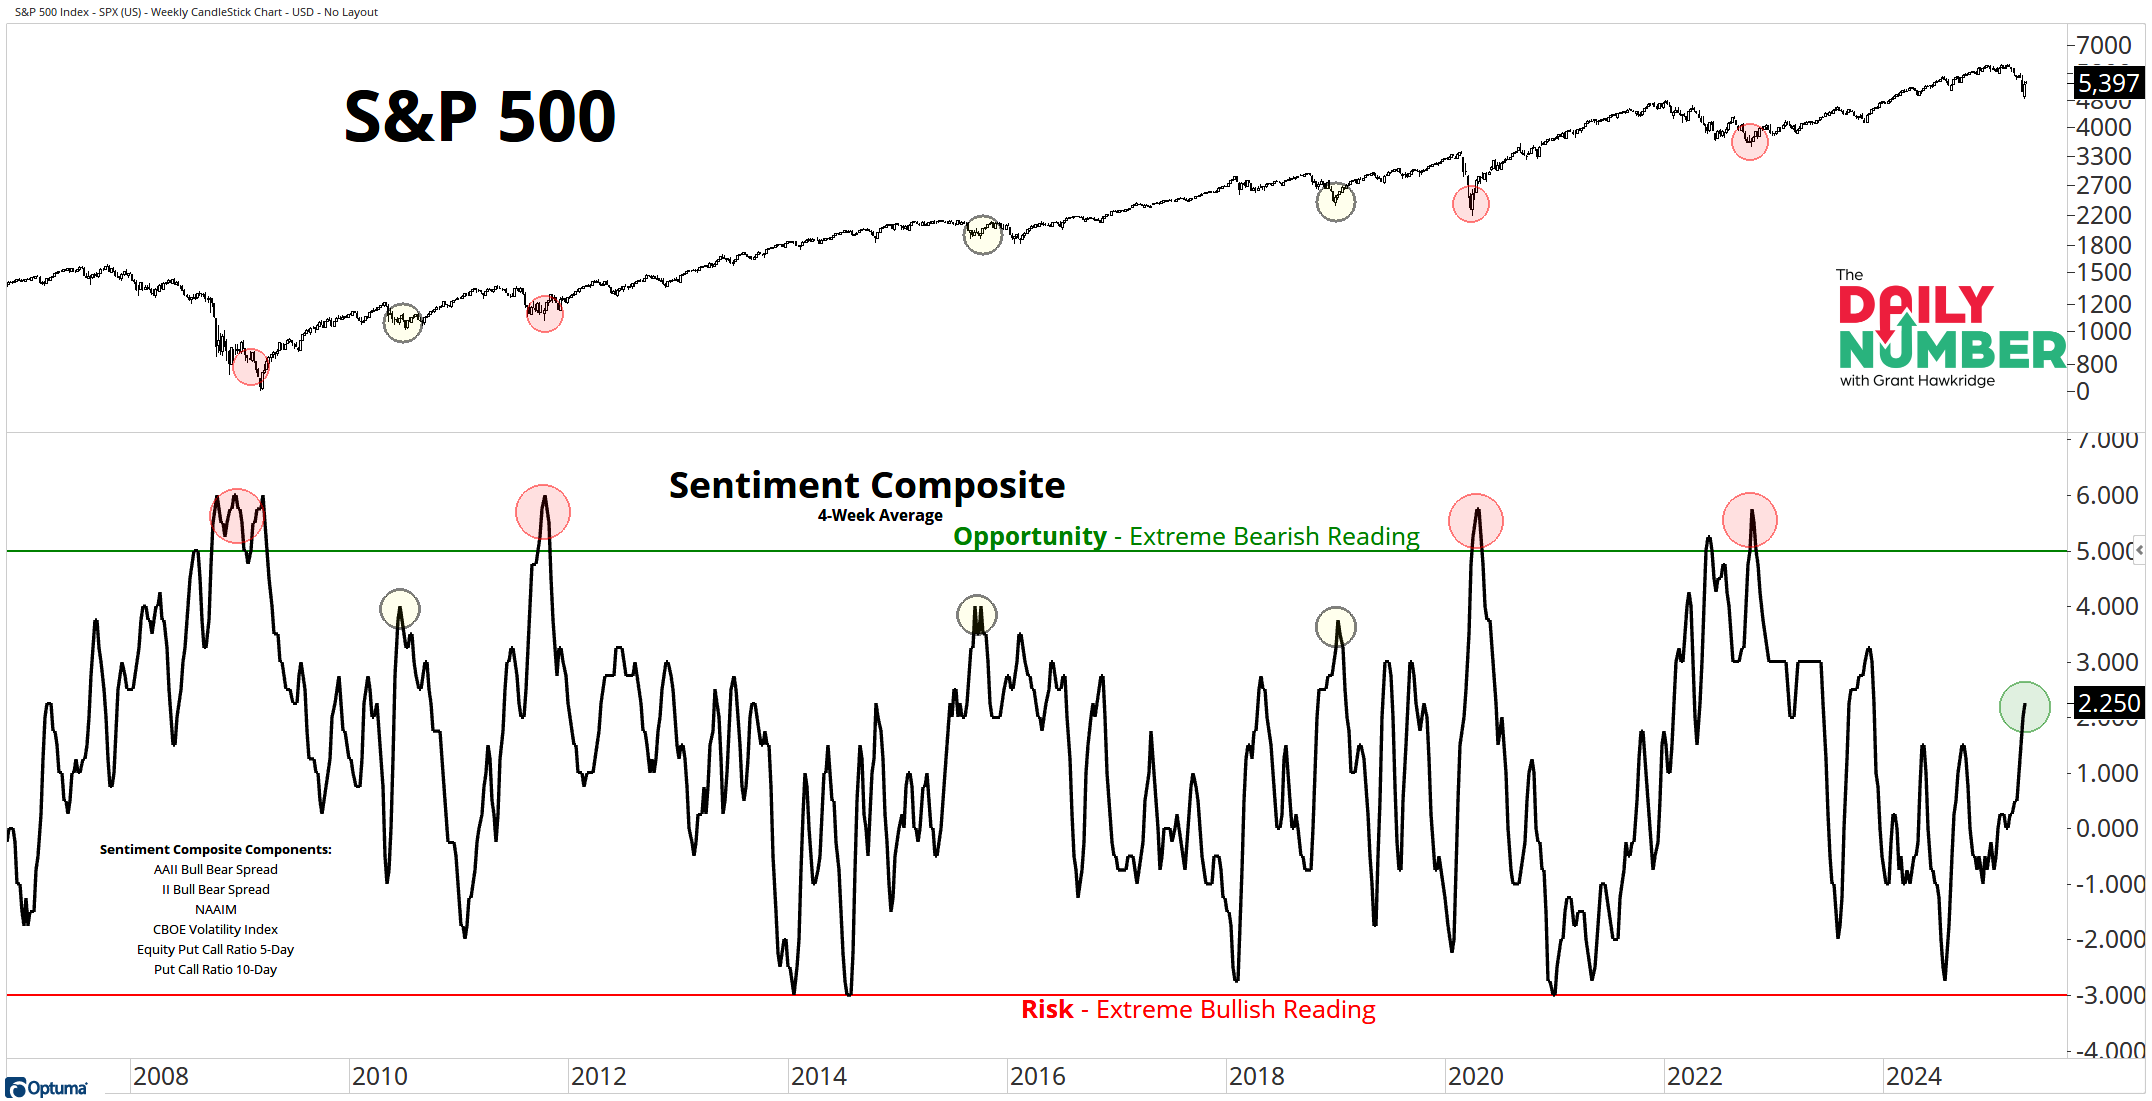
The black line in the top panel represents the price of the S&P 500 index.
The black line in the bottom panel represents my sentiment composite, which includes six different sentiment data points: AAII Bull Bear Spread, II Bull Bear Spread, NAAIM, CBOE Volatility Index, Equity Put Call Ratio 5-Day, and Put Call Ratio 10-Day.
The Takeaway: We are currently seeing more bears than bulls enter the market, as my sentiment composite has reached a new 16-month high. It's remarkable how price action can influence sentiment. Just six months ago, we were experiencing optimism, but now the environment for investors has turned much more pessimistic.
While I acknowledge that this sentiment composite is not perfect, it does provide a useful perspective on what investors are thinking at the moment.
The way I use sentiment is to determine whether it acts as a potential tailwind, as it did for much of 2024, or if it is becoming a headwind. As we are witnessing right now. However, there is still plenty of room for bearish sentiment to expand before it becomes extremely bearish, which then could present opportunities – Buy when everyone is fearful.
So, is this stock market poised for another leg lower, which could possibly push the sentiment composite into extreme bearish territory similar to what we saw in 2008, 2011, 2020, and 2022 (as indicated by the red circles on the chart)?
Or is this situation more akin to the more mild market corrections we experienced in 2010, 2015, and 2019 (indicated by the gray circles on the chart)?
If you find my content valuable, I would greatly appreciate it if you could share it with your friends, family, and colleagues. Your help in spreading the word is invaluable in supporting our work. Thank you to all of you who share!