There’s Nothing More Bullish Than All-Time Highs 📈
August 12, 2025
Today's number is... 16
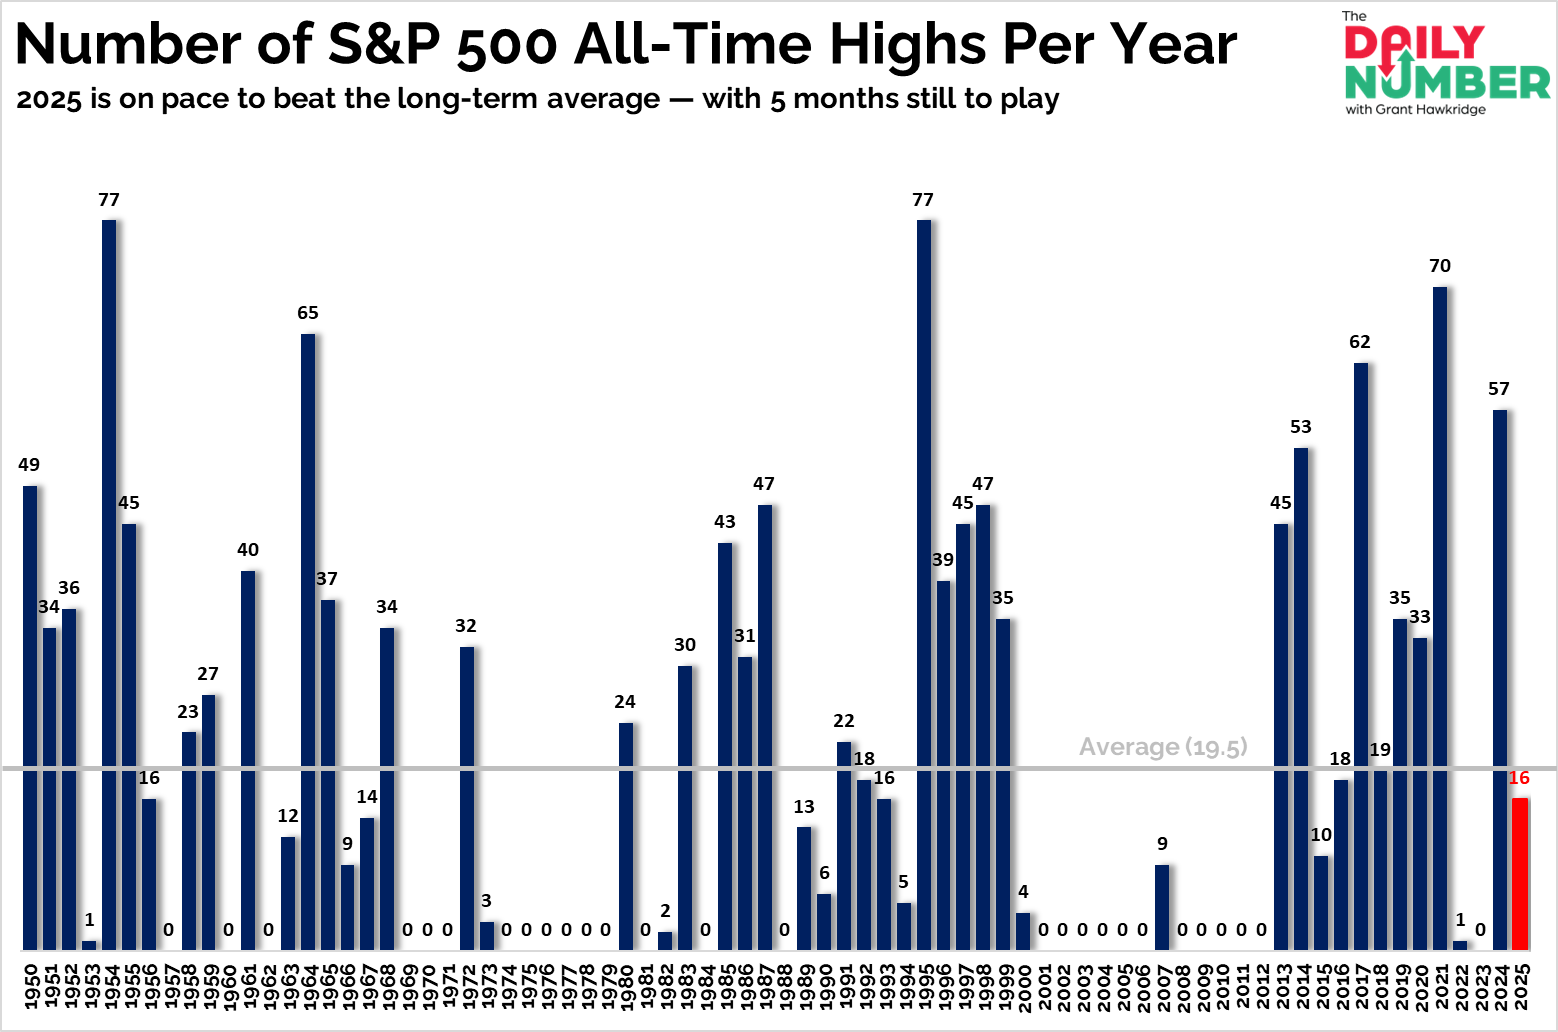
That’s how many all-time closing highs the S&P 500 has posted so far in 2025.
Here’s the chart:
Let's break down what the chart shows:
The bar chart plots the number of S&P 500 all-time closing highs for each calendar year from 1950 to 2025.
Each vertical blue bar represents the annual total for all-time highs.
The horizontal grey line marks the historical average of all-time highs per year.
The Takeaway: All-time highs aren’t just a headline — they’re the cleanest proof of trend strength.
Price is now in uncharted territory.
Every buyer is sitting on gains.
And there’s zero overhead supply to slow this momentum.
We’re at 16 all-time highs in 2025 — just shy of the 19.5 yearly average.
But with five months still on the clock. Even an average finish from here would push 2025 well above the mean.
History shows that clusters of all-time highs tend to come in powerful secular or cyclical bull markets — not in topping phases. Years with 15–25 highs by this point often see acceleration into year-end.
Right now, the S&P 500 is up 9.6% YTD and making fresh records. That’s not a market under stress — that’s a market pressing the advantage.
The question now: how high can this count run before the calendar closes?
Grant Hawkridge | Chief Aussie Operator, All Star Charts
Need a full trading toolkit that actually helps you make moves? All Star Charts Premium gives you daily trade ideas, proprietary scans, and access to our entire analyst team. If you're serious about leveling up your strategy,start here.
If you find my content valuable, I would greatly appreciate it if you could share it with your friends, family, and colleagues. Your help in spreading the word is invaluable in supporting our work. Thank you to all of you who share!