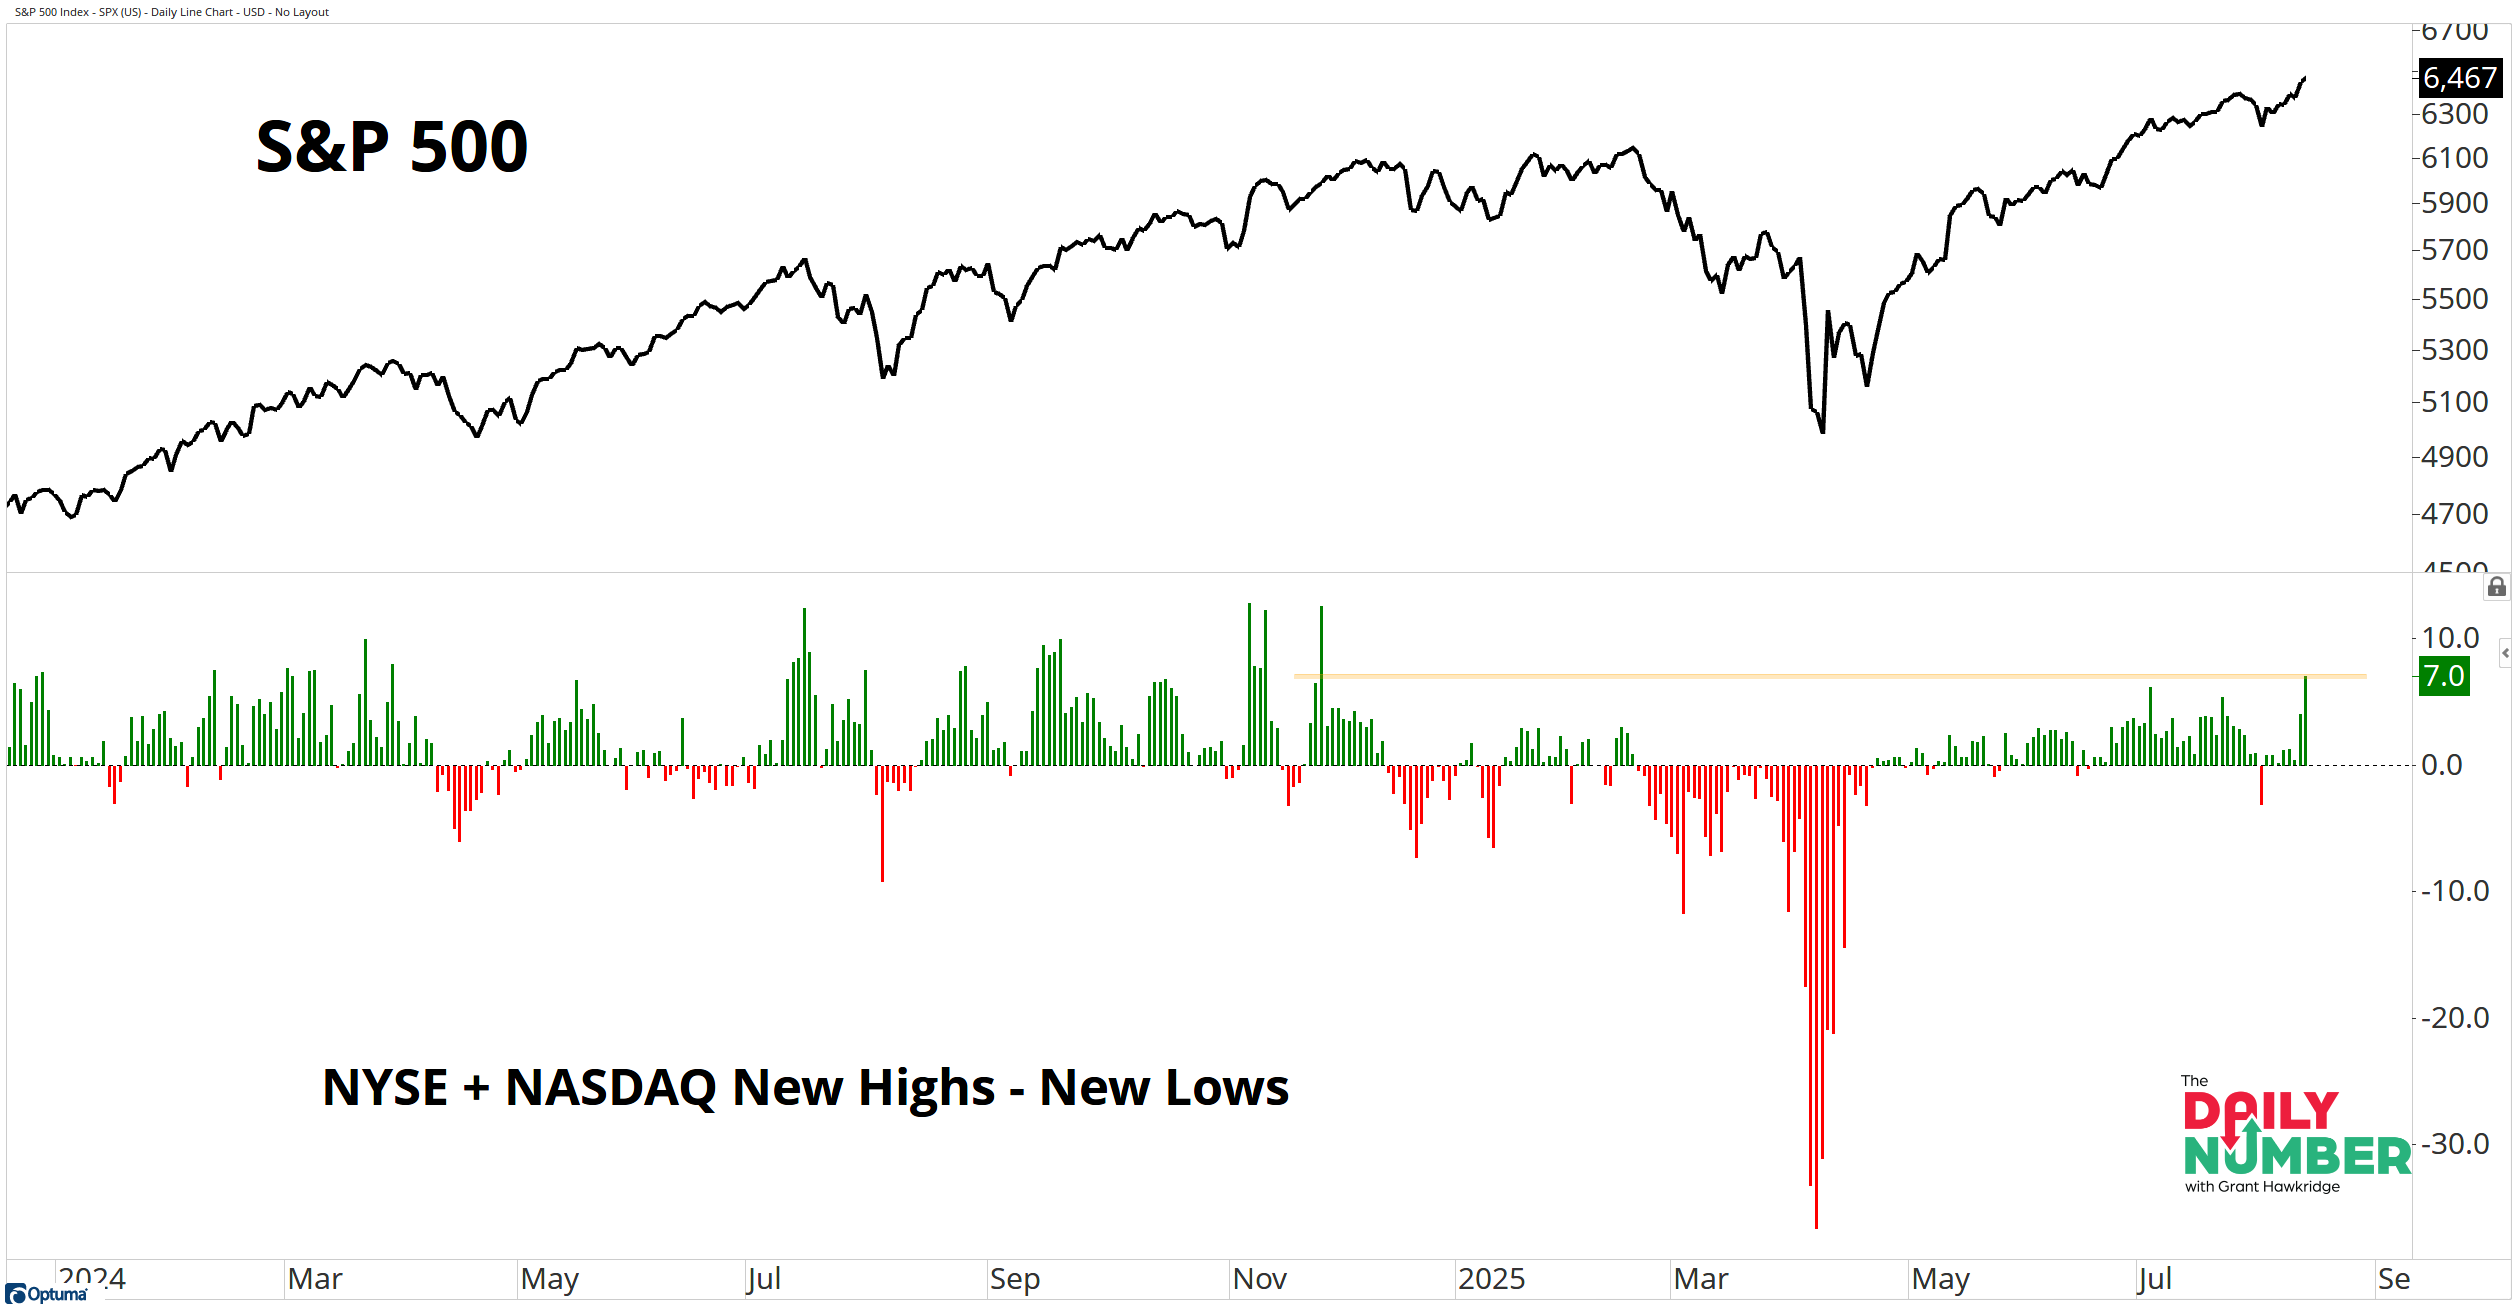
The NYSE + NASDAQ Net New Highs (new highs minus new lows) is at 7%, the strongest daily reading since 25 November 2024.
Here’s the chart:
Let's break down what the chart shows:
The top panel plots the S&P 500 daily close as a black line.
The lower panel shows daily NYSE + NASDAQ Net New Highs as vertical bars: green for positive, red for negative.
The Takeaway: This is Summer breadth — expansion, not contraction.
Net New Highs pushing to a nine-month high says participation is widening, not narrowing.
This confirms the trend rather than questioning it.
You don’t make year-to-date highs in the NYSE + NASDAQ net new highs when breadth is contracting.
Breadth expansion is the stuff bull markets are made of.
Rotation can create short-term noise and divergences, but sustained downside typically shows up as a surge in new lows and a decisive flip of the NYSE + NASDAQ net new highs into negative territory.
We’re not seeing that.
Instead, more stocks are headed higher than they are headed lower.
This is fuel, not friction.
As long as Net New Highs stay positive and rising, the path of least resistance is higher.
What would change this message?
A warning sign. An unusual spike in the 52-week lows would mark the “first fall day”
Until that shows up, breadth isn’t the problem. It’s the tailwind.
Grant Hawkridge | Chief Aussie Operator, All Star Charts
Need a full trading toolkit that actually helps you make moves? All Star Charts Premium gives you daily trade ideas, proprietary scans, and access to our entire analyst team. If you're serious about leveling up your strategy,start here.
If you find my content valuable, I would greatly appreciate it if you could share it with your friends, family, and colleagues. Your help in spreading the word is invaluable in supporting our work. Thank you to all of you who share!