This move started months ago, and the charts say it’s just getting started.
By Sam Gatlin, Jason Perz
March 27, 2026
Over the past several weeks, we’ve been making one thing very clear around here.
This move in energy is not a fluke. It's a structural shift.
And yet, everywhere you look, the narrative is the same: “This is just about Iran.”
No, it isn’t...
If you step back and actually look at the charts, this move in energy didn’t start with any geopolitical headline.
It didn’t begin with conflict...
It didn’t need a catalyst...
What we’re seeing now is simply the market accelerating in the direction it was already heading.
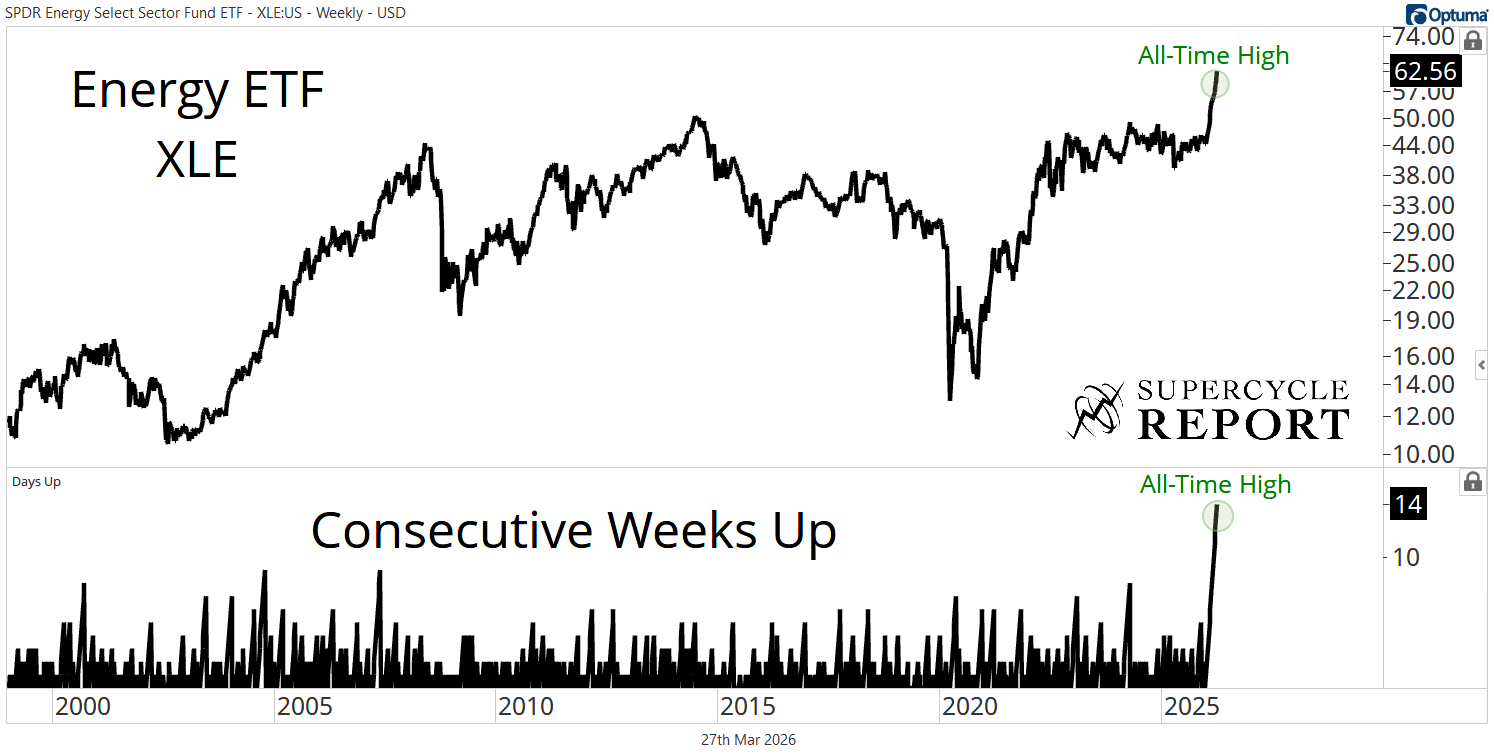
Take the Energy ETF $XLE as an example.
This group hasn’t had a down week since mid-December 2025. That's fourteen consecutive weeks higher, which has literally never happened before.
Not once...
Think about what that means.
That’s persistent, overwhelming demand, and institutions allocating capital in size.
And now, price is printing fresh all-time highs, putting the finishing touches on a massive multi-decade base that’s been building for years.
This is exactly how secular uptrends begin.
Sure, in the very short-term, things are stretched. They always are after moves like this.
But there is absolutely nothing bearish about an overwhelming amount of demand relative to supply.
Markets don’t go straight up for 14 weeks unless something bigger is going on beneath the surface.
And we think there is.
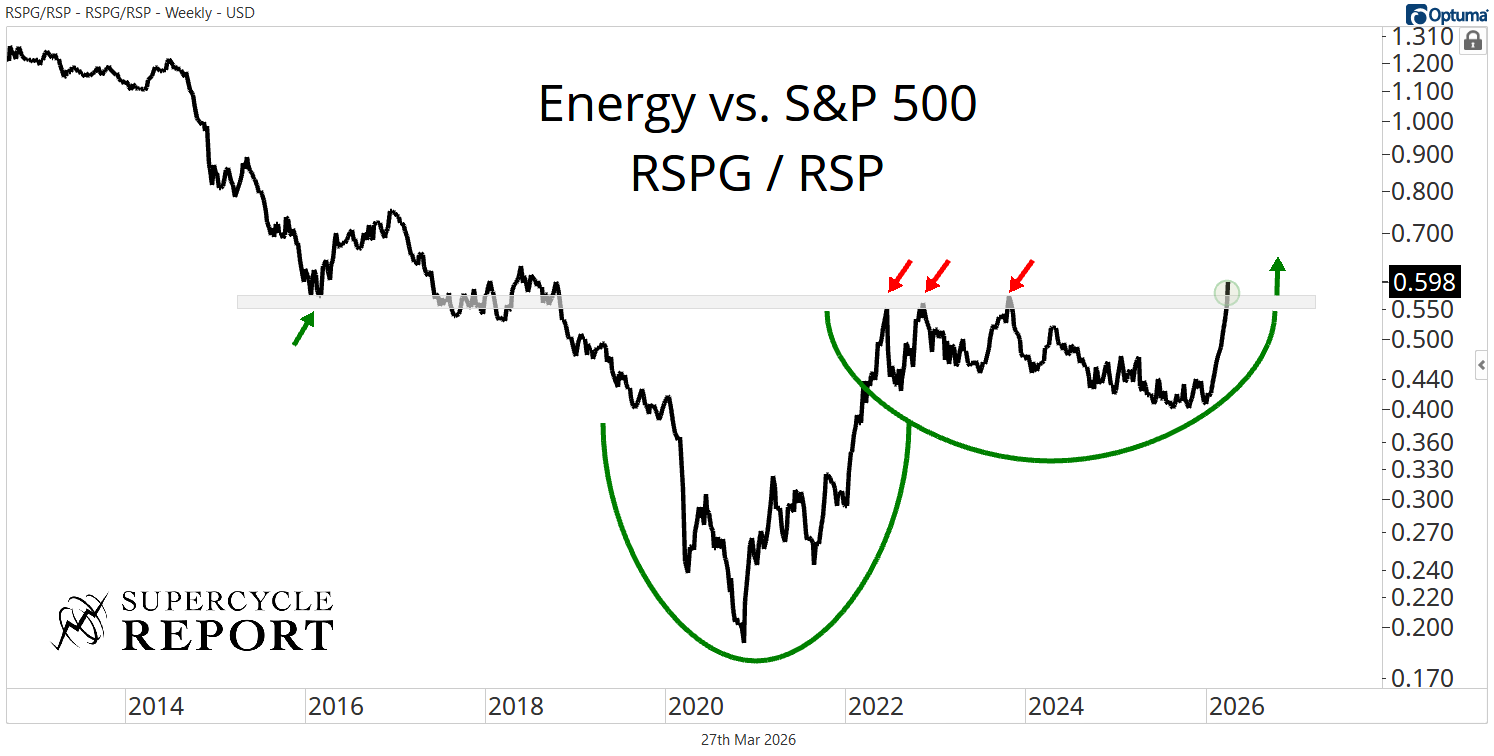
Zoom out, and the bigger story becomes even clearer when you look at energy relative to the broader market.
The equal-weight ratio of energy stocks to the S&P 500 has just reached its highest level since 2018.
More importantly, it’s resolving higher from a multi-year base, a textbook bearish-to-bullish reversal pattern that has been building since the 2020 lows.
This is the kind of setup that leads to sustained outperformance.
In other words, it’s not just that energy is going up.
It’s that energy is becoming leadership.
And that’s a very different conversation.
For years, this sector has been underowned, unloved, and overlooked.
It accounted for a tiny fraction of the S&P 500, while capital flowed into sectors like technology.
That’s changing now.
And if this relative breakout continues as we expect, energy will take up a much larger share of the index over time.
That means flows, which equate to persistent demand.
The kind of demand that drives trends higher for much longer than most people think is possible.
That’s why we’ve been so confident in this theme.
And it’s why we continue to believe that names like ExxonMobil $XOM have a clear path toward a $1 trillion market cap.
Will there be volatility? Of course.
Could headlines out of the Middle East create short-term noise? Absolutely.
But the key point is this: the trend was already in motion before any of that.
And trends like this don’t just disappear because of one headline or another.
They persist and feed on themselves.
And right now, all the evidence suggests that this energy move is still in its early innings.
What are you seeing in commodities? Let us know what you think. We may include your comment in a future post!
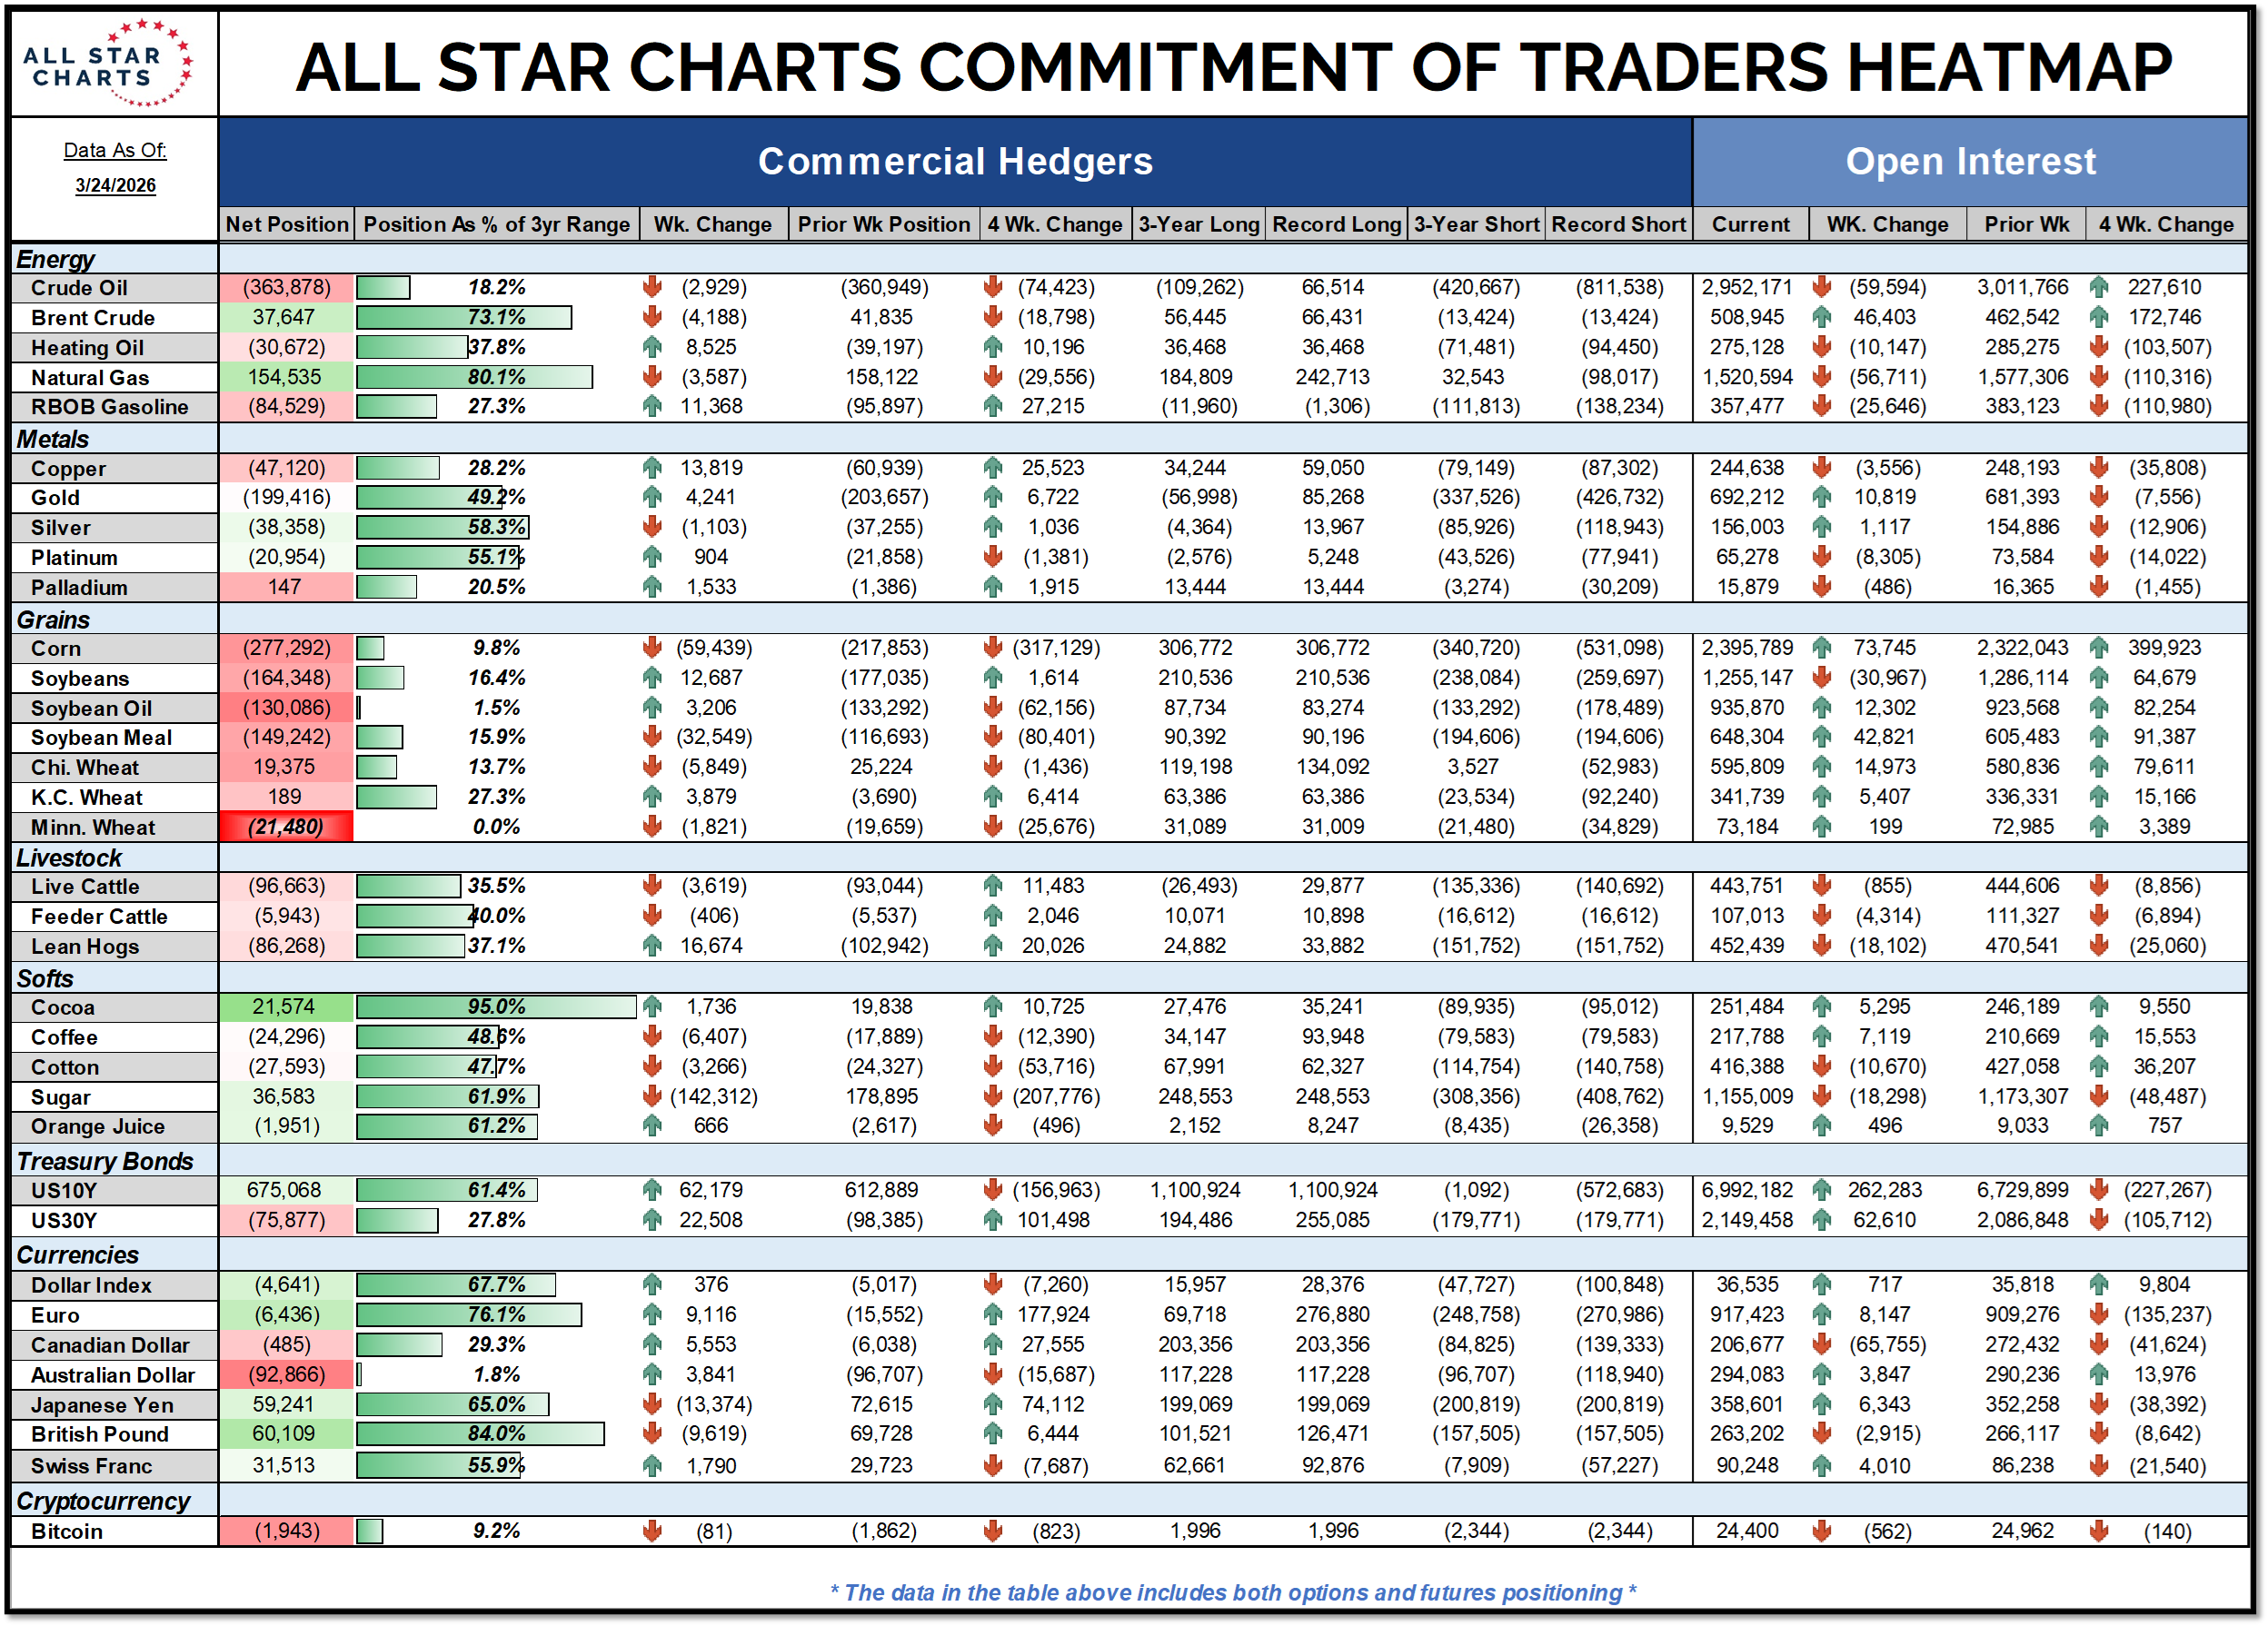
Commitment of Traders Highlights
Grains - Commercial hedgers set a new multi-year extreme net-short Minneapolis Wheat position. We think a fresh leg higher in the price is coming soon.
Crypto - Commercials built on one of their largest net-short Bitcoin positions in years. We expect a continued headwind for the world's largest cryptocurrency.
Energy - Commercial hedgers trimmed their massive net-short RBOB Gasoline position by more than 11,000 contracts. This is perfectly normal behavior, as they're using the recent strength to sell into.
This week, we're highlighting one of our favorite setups in the energy sector. Unlike the broader group, this name isn't extended. It's just getting started...
Premium members can see the entry and target levels below. 👇
You need to have a subscription to access this content in full.
Log in or subscribe today to unlock new features and receive Member Benefits.


