The yield curve warned us. CRB compressed. XLE broke out.
By Jason Perz
January 29, 2026
For months, the yield curve has been doing what it always does before big commodity and energy moves: it started whispering before price started screaming.
This wasn’t a headline trade. This wasn’t a CPI print trade. This was a structure trade.
And it started with the yield curve.
CRB vs. the Yield Curve — The Signal Before the Move
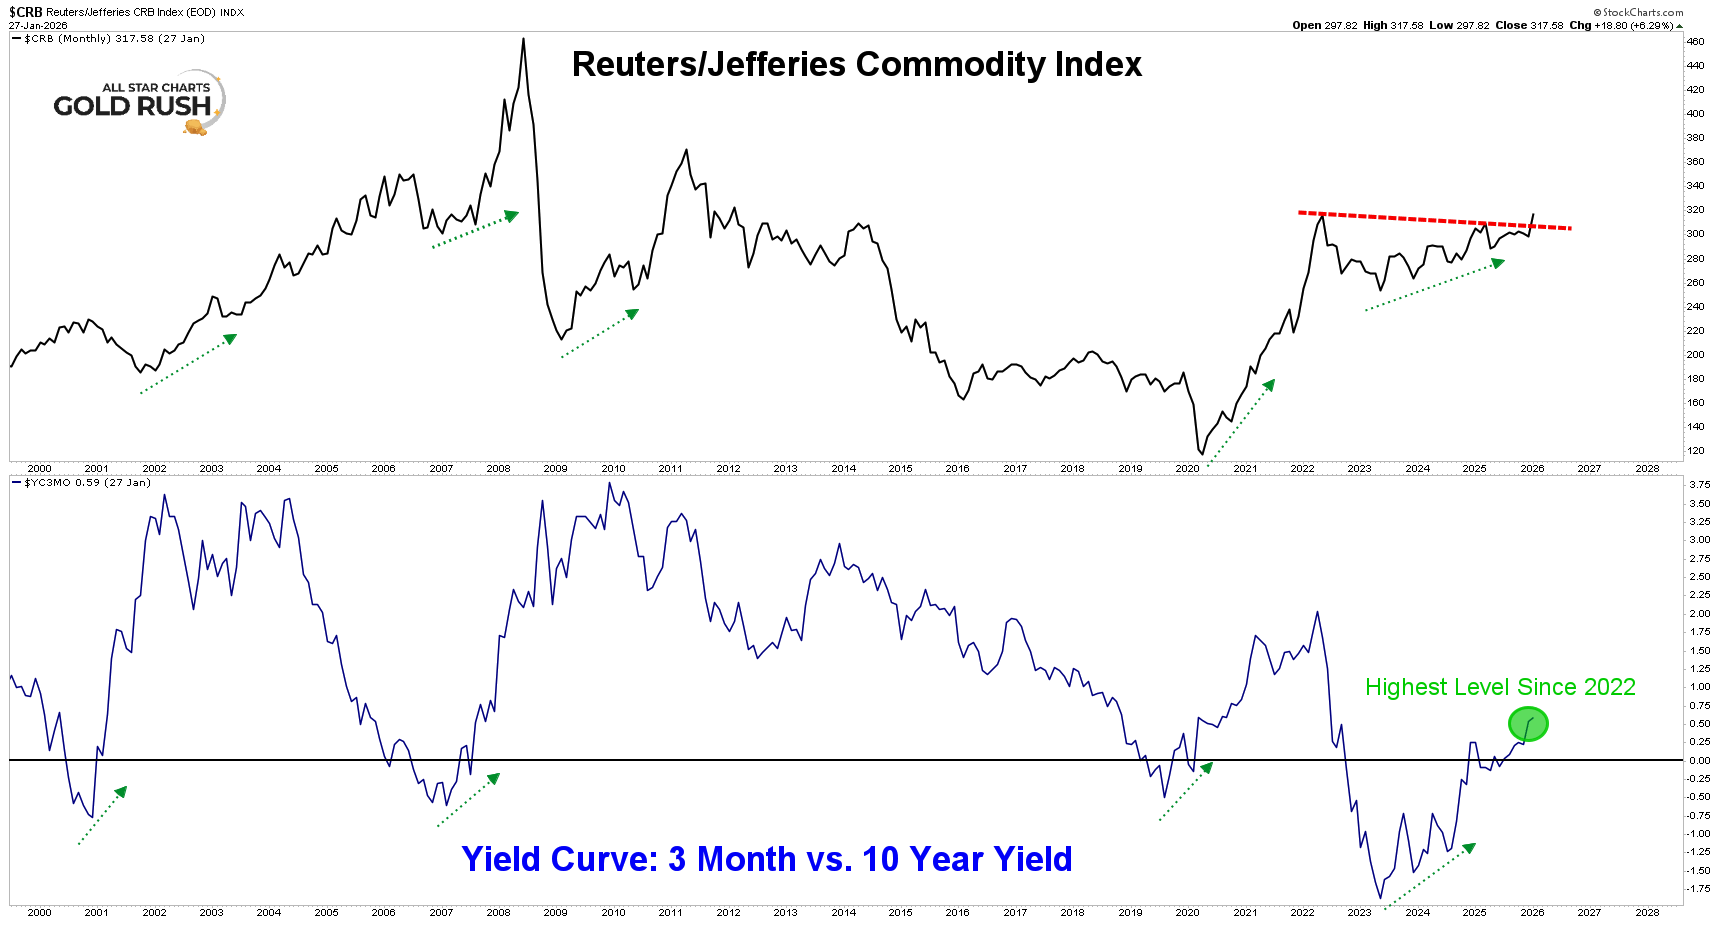
The first chart matters because it shows cause before effect.
The Reuters/Jefferies CRB Index is not some abstract inflation gauge. It’s heavily weighted toward energy — oil, gasoline, heating oil, and refined products dominate the index. When CRB moves, energy is usually doing the heavy lifting.
Now overlay that with the 3 month vs. 10 year yield curve as you see above.
Every major up-cycle in commodities over the last two decades has been preceded by the same setup:
The yield curve bottoms
It starts to steepen
Commodities follow
That’s exactly what we’ve been watching unfold.
The yield curve has been pushing to its highest level since 2022, and that matters. Not because it “predicts” inflation headlines — but because it reflects liquidity, growth expectations, and risk appetite returning.
We’ve been updating members on this again and again. The message hasn’t changed:
When the curve turns, commodities don’t stay quiet for long.
Energy doesn’t lead every cycle — but when the curve steepens and reflation starts to show up, energy is usually early.
CRB Bollinger Band Squeeze — Pressure Builds, Then Releases
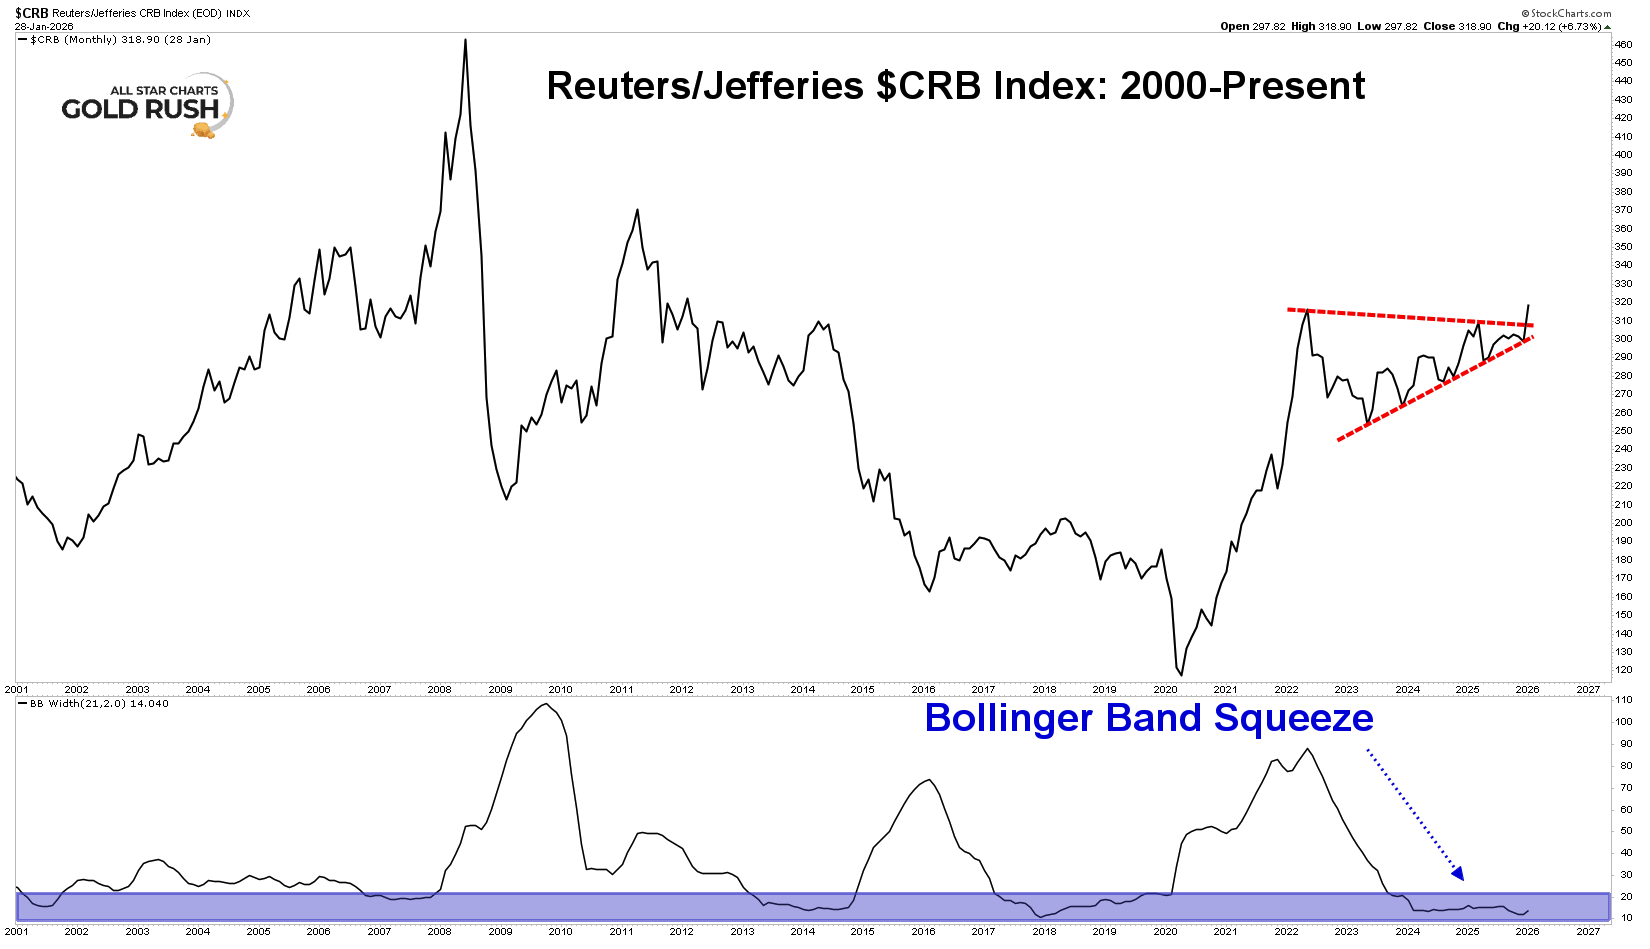
The second chart is the confirmation layer.
The CRB Index spent an extended period locked inside extremely tight Bollinger Bands. This is not noise. This is compression.
Bollinger Band squeezes tell you one thing:
A big move is coming — direction is resolved by trend.
And the long term trend here has already turned higher.
What matters is where the squeeze occurs. This one showed up after:
A multi year base
A successful retest
A higher low structure
Now we’re seeing the CRB break out of that compression.
Historically, when CRB exits a squeeze like this, the first leg is rarely the last leg. These moves tend to unfold in waves, not straight lines. Which is exactly why we didn’t chase junk, headlines, or levered lottery tickets.
We stalked strength.
Because this kind of setup doesn’t reward impatience — it rewards positioning.
XLE — The Level That Mattered
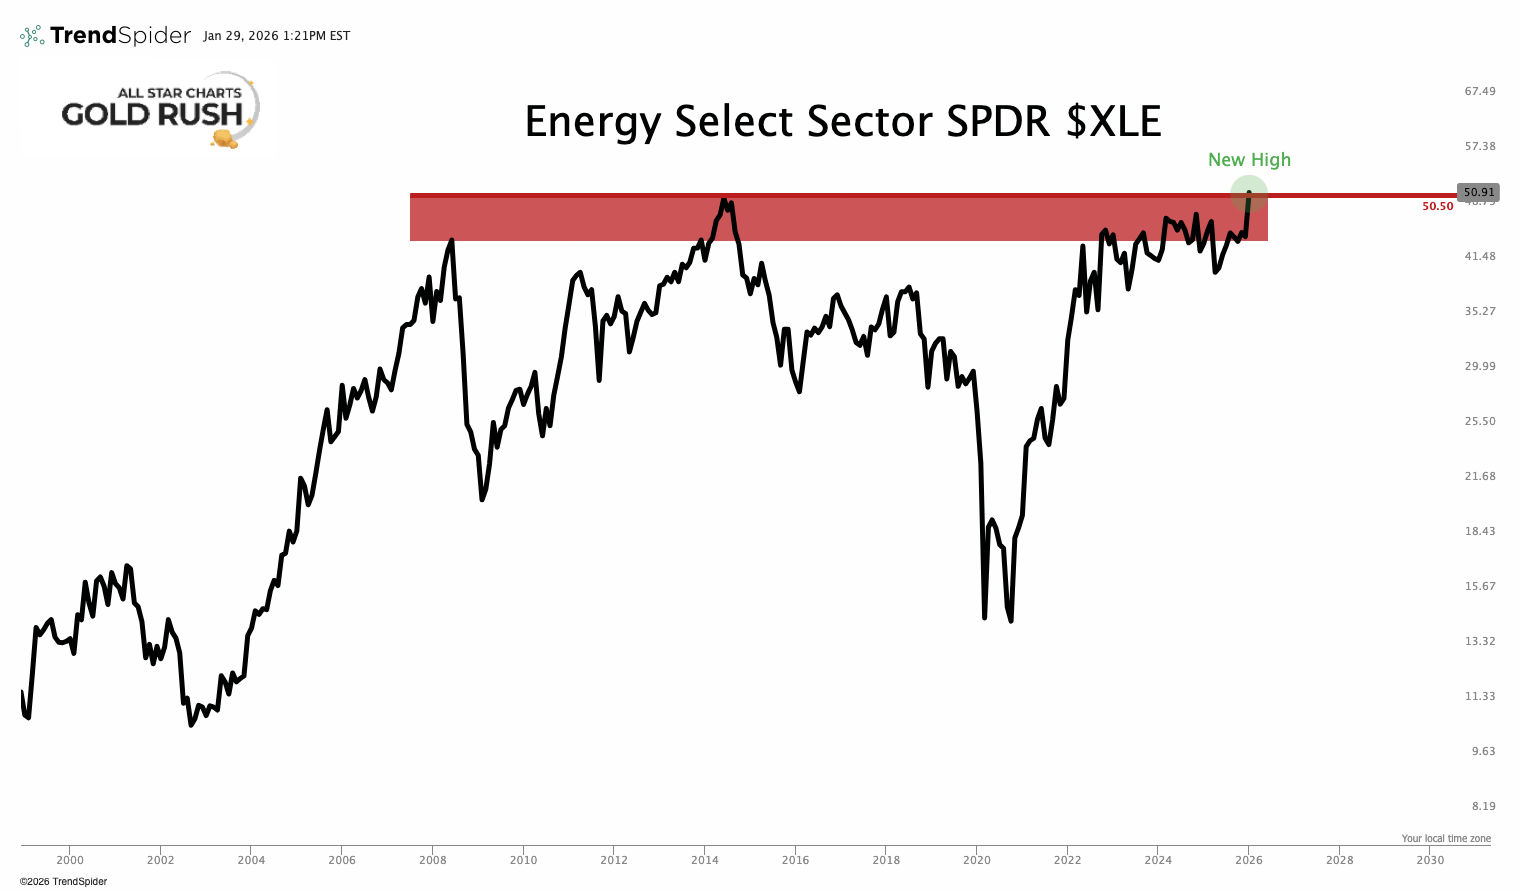
The third chart is where theory meets execution.
XLE has been on our radar for a long time. Not because it was exciting — but because it was coiling beneath one level that kept rejecting price.
That level was 50.50.
We said it repeatedly:
If XLE can get up and over 50.50 and hold, energy is no longer a trade — it’s a trend.
And here we are.
Price didn’t explode out of the gate. It worked. It absorbed supply. It kept printing higher lows while sentiment stayed muted. That’s exactly how real breakouts form.
Now XLE is through resistance, and the market is finally catching up to what price has been telling us for months.
This is why we focused on:
Strong names
Strong balance sheets
Strong relative strength
Strong sectors inside energy
No need to swing at everything. You don’t need to be everywhere — you need to be right.