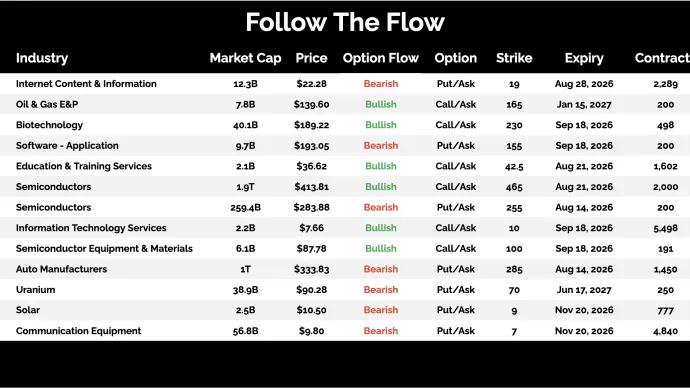
Steve Strazza The Daily Flow Three names lining up for the next leg, and the flow already committed July 23, 2026 All Star Charts Premium
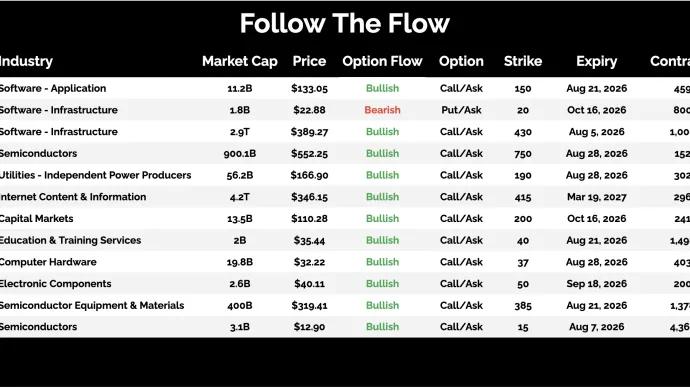
Steve Strazza The Daily Flow Beaten names catching call flow before the crowd circles back July 22, 2026 All Star Charts Premium