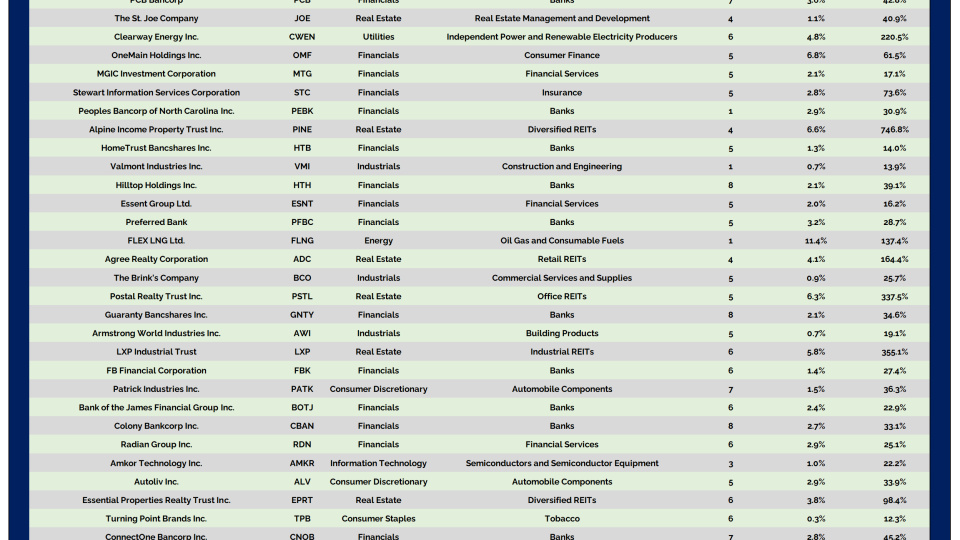
Dividend Aristocrats are easily some of the most desirable investments on Wall Street. These are the names that have increased dividends for at least 25 years, providing steadily...
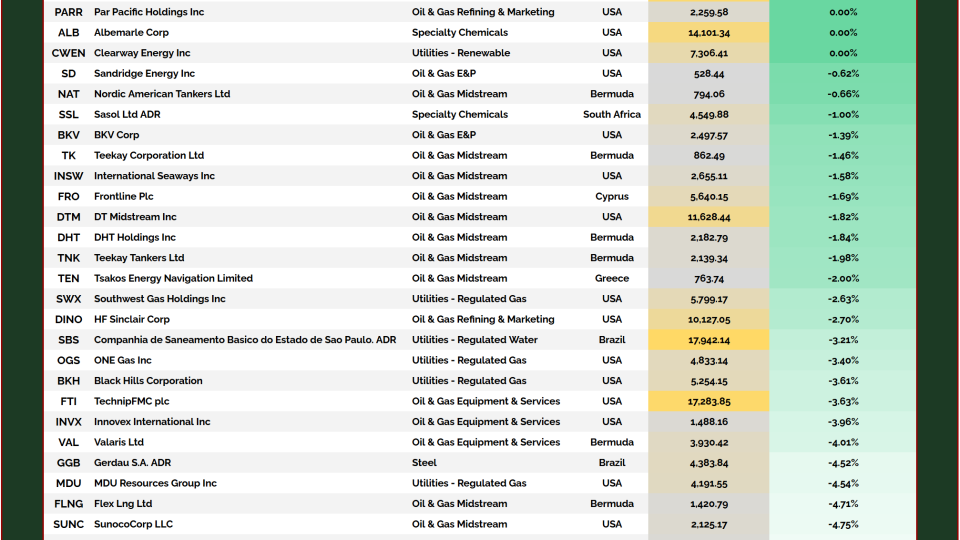
There comes a moment in every long, grinding bear market when the selling exhausts itself and nobody cares anymore. The last marginal seller has finally thrown in the towel.
And when an entire corner of the commodity market gets left for dead,...
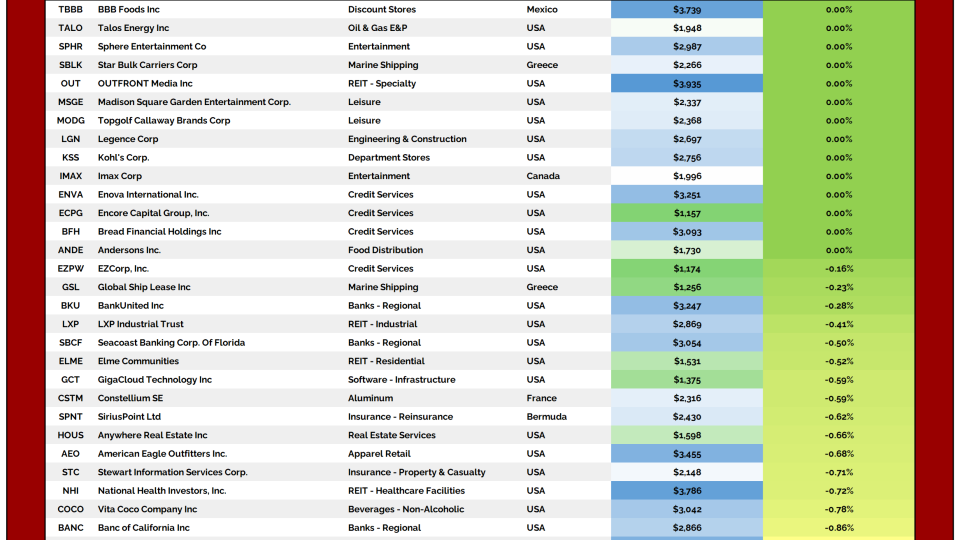
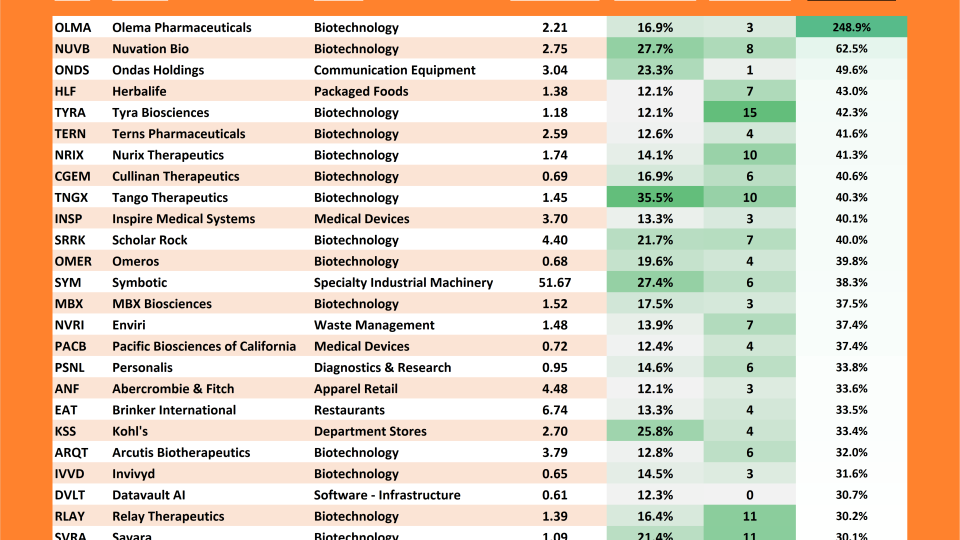
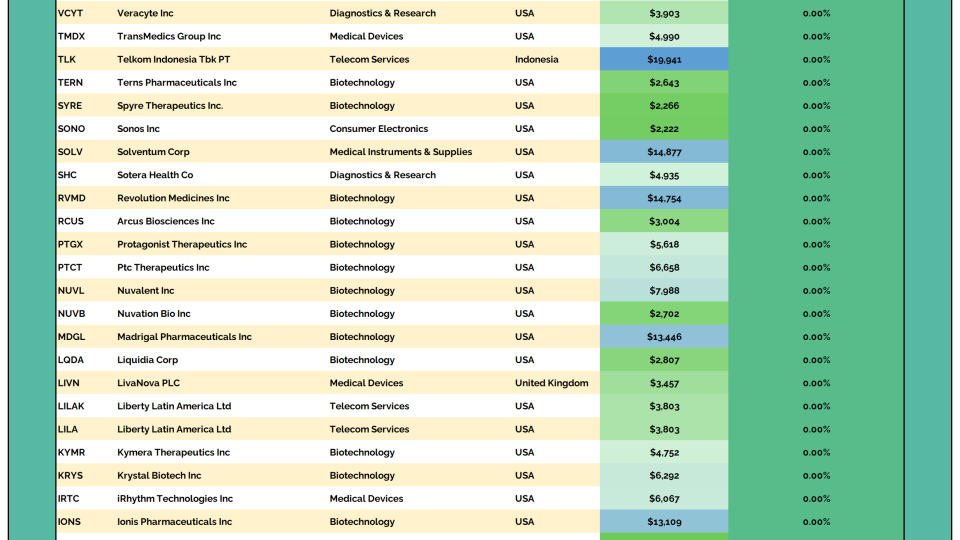
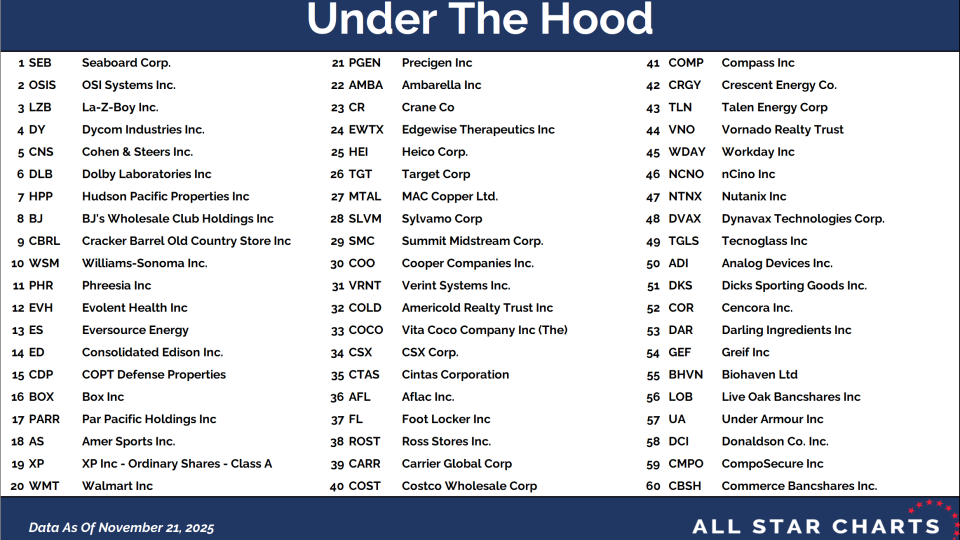
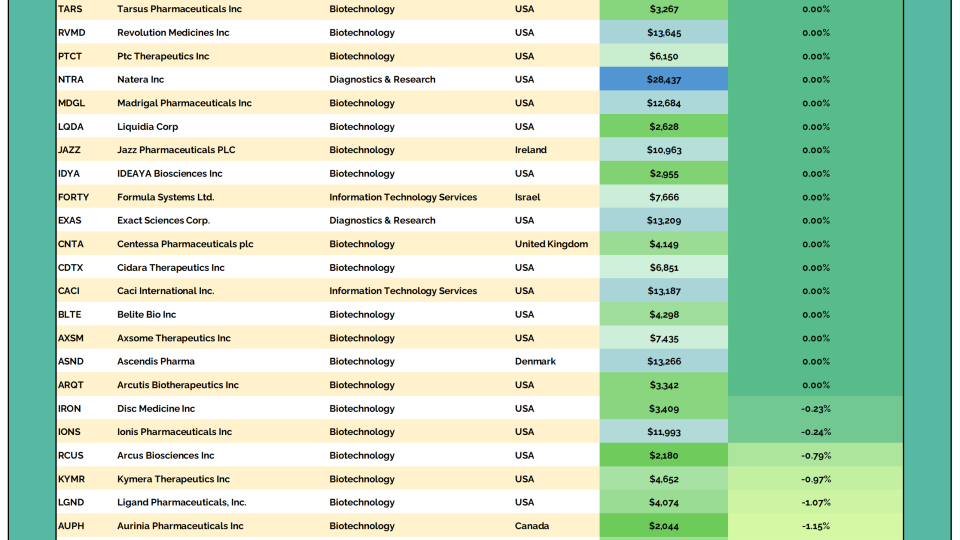
We love our bottoms-up scans here at All Star Charts. We tend to get really creative when making new universes as we want to be sure they will deliver us the best opportunities the market has to...
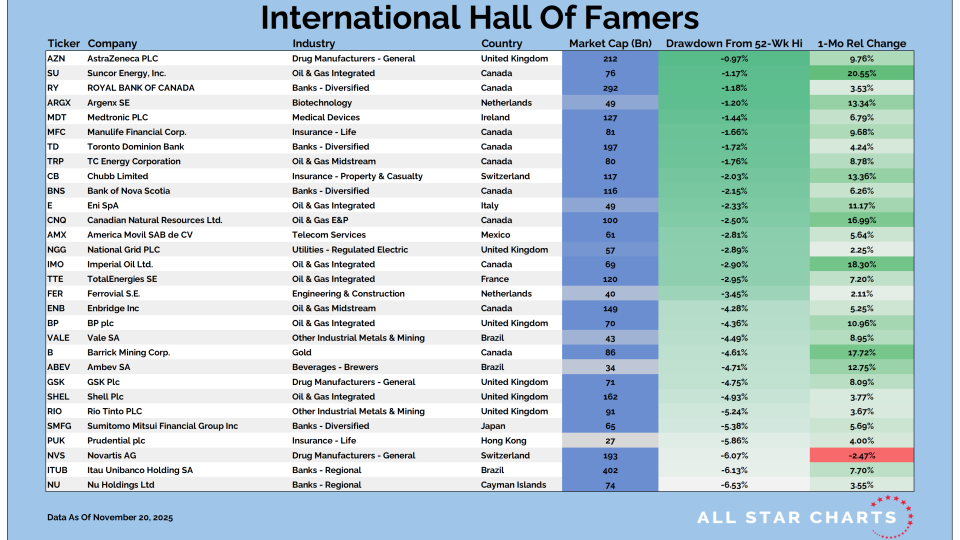
Most natural resource stocks, even the bellwethers of Metals or Energy, for example, can’t scale to $3 Trillion in market cap. They’re simply not built like the juggernauts of tech or communications.