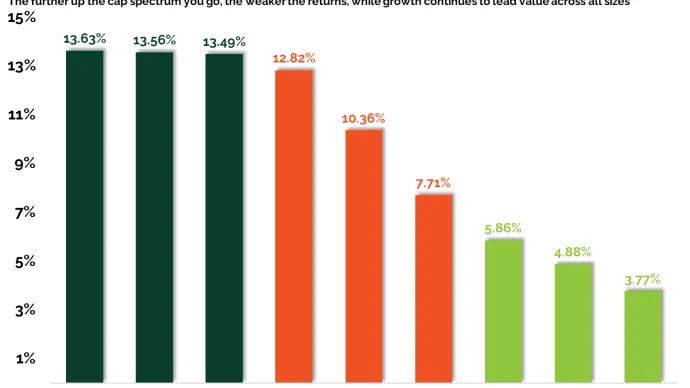
Grant Hawkridge Small Caps Are Leading This Market 🚀 Today's number is... 13.6%S&P 600 small caps are up 13.6% year to date, leading every major size and style group.Here’s the chart: Let's break down what the chart shows:... April 28, 2026 The Daily Number Grant
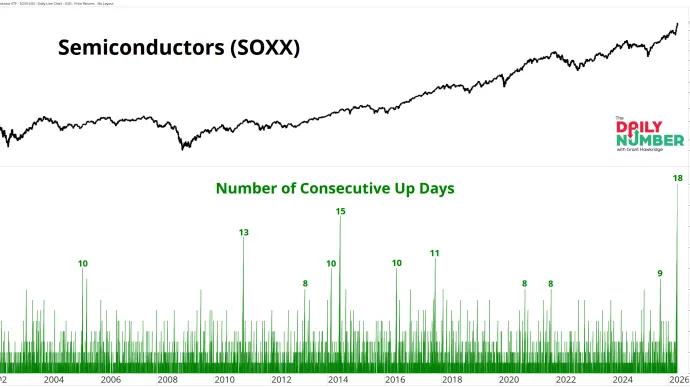
Grant Hawkridge Semis Just Did Something They’ve Never Done 🚀 Today's number is... 18Semiconductors just closed 18 days higher in a row. That is the longest streak on record.Here’s the chart: Let's break down what the chart shows:... April 27, 2026 The Daily Number Grant
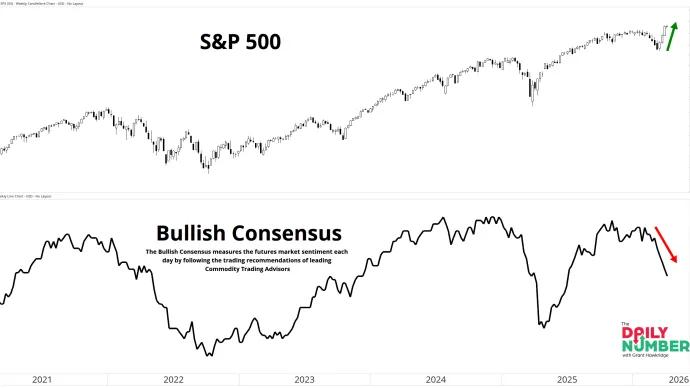
Grant Hawkridge Stocks Are Breaking Out… And Nobody Cares 📈 Today's number is... 56Bullish Consensus is at 56, sitting mid-range while the S&P 500 pushes back to all-time highs.Here’s the chart: Let's break down what the chart shows:... April 23, 2026 The Daily Number Grant
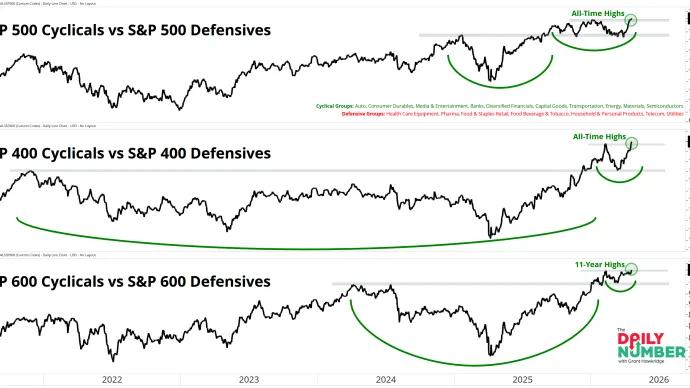
Grant Hawkridge Risk Appetite Is Hitting Across All 3 Market Caps 🚀 Today's number is... 3Three cyclical vs defensive ratios are breaking out together across large, mid, and small caps.Here’s the chart: Let's break down what the chart shows:... April 22, 2026 The Daily Number Grant
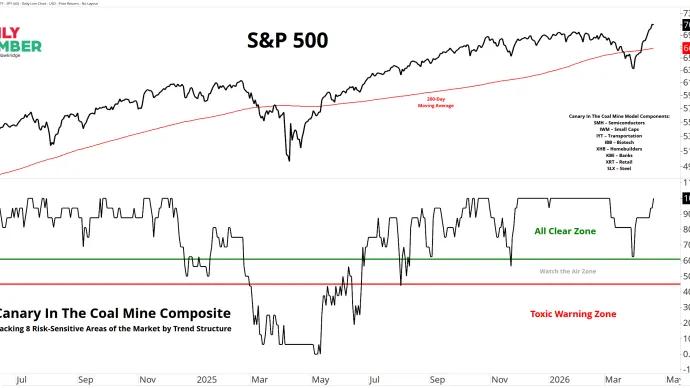
Grant Hawkridge The Score Dropped. Then Snapped Back 📈 Today's number is... 100The Canary In The Coal Mine Composite is sitting at 100, with all eight canaries back above their 200-day moving average, and all are trending higher.Here’s the chart: ... April 21, 2026 The Daily Number Grant
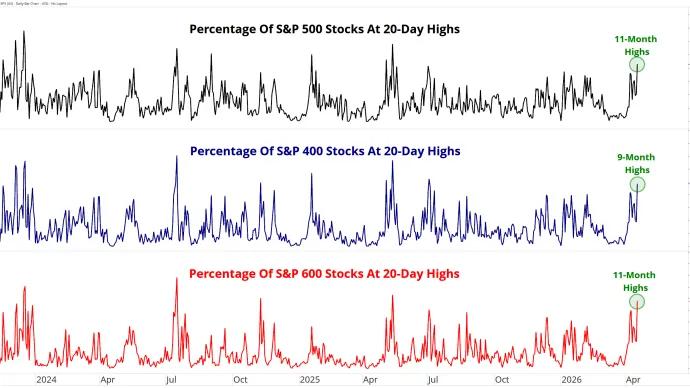
Grant Hawkridge Short-Term Breadth Is Expanding Fast 📈 Today's number is... 2020-day highs are surging, with 58% of small caps, 48% of mid caps, and 43% of large caps pushing to fresh short-term highs.Here’s the chart: Let's break down what the... April 20, 2026 The Daily Number Grant
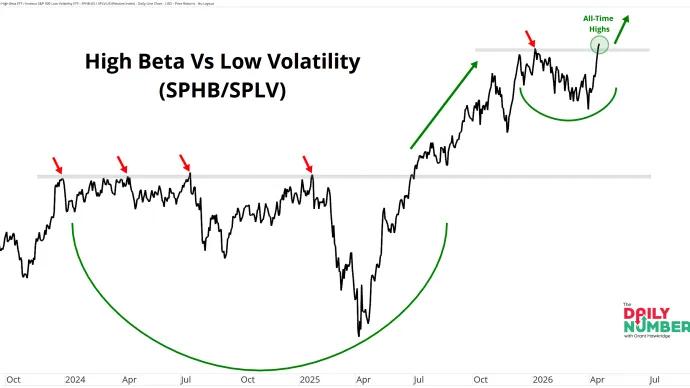
Grant Hawkridge Risk Is Back on Offense 📈 Today's number is... 1.74The High Beta vs Low Volatility ratio just broke out to fresh all-time highs at 1.74.Here’s the chart: Let's break down what the chart shows:... April 17, 2026 The Daily Number Grant
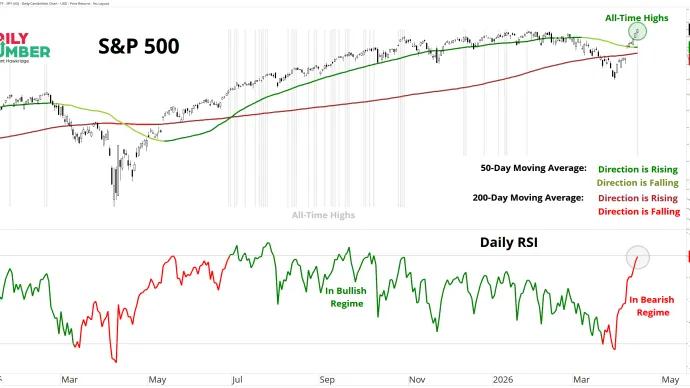
Grant Hawkridge Bears Took Their Shot And Missed 📈 Today's number is... 5The S&P 500 just printed its 5th all-time high of the year.Here’s the chart: Let's break down what the chart shows:... April 16, 2026 The Daily Number Grant
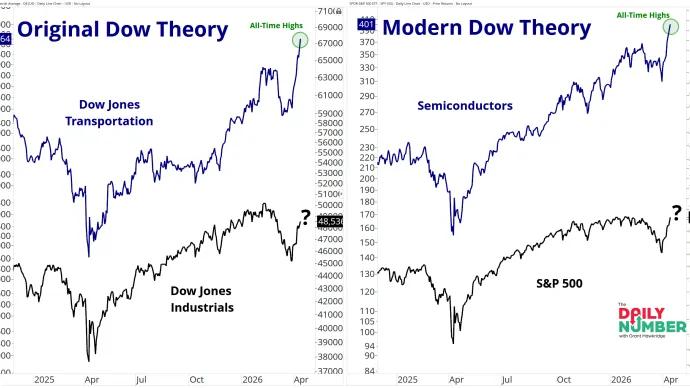
Grant Hawkridge Confirmation Pending, Not Broken❓ Today's number is... 2Two leadership groups are already at all-time highs.Here’s the chart: Let's break down what the chart shows:... April 15, 2026 The Daily Number Grant
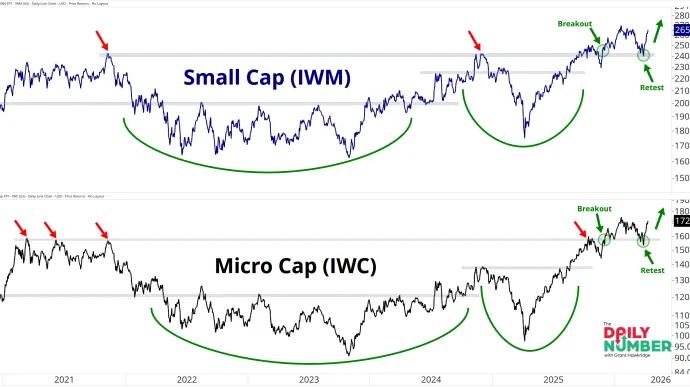
Grant Hawkridge Risk Is Showing Up in the Smallest Stocks 🚀 Today's number is... 2Two risky areas of the market, Small Caps and Micro Caps, have followed the same multi-year basing pattern breakout, retest, and expansion attempt.Here’s the chart: Let'... April 14, 2026 The Daily Number Grant
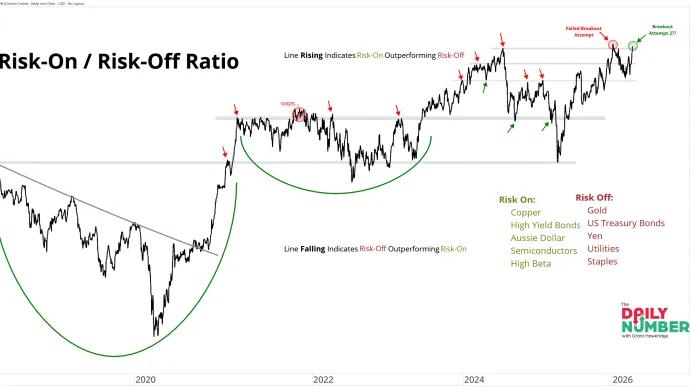
Grant Hawkridge Back Where It Failed 📈 Today's number is... 147My custom Risk-On vs Risk-Off ratio is back testing the 147 level.Here’s the chart: Let's break down what the chart shows:... April 13, 2026 The Daily Number Grant
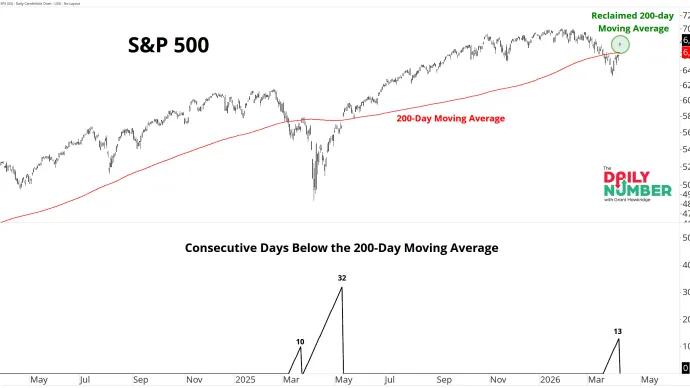
Grant Hawkridge The Market Just Took Back a Key Level 📈 Today's number is... 13The S&P 500 spent 13 days below its 200-day moving average before reclaiming it with a 2.5% rally yesterday.Here’s the chart: Let's break down what the chart shows... April 9, 2026 The Daily Number Grant
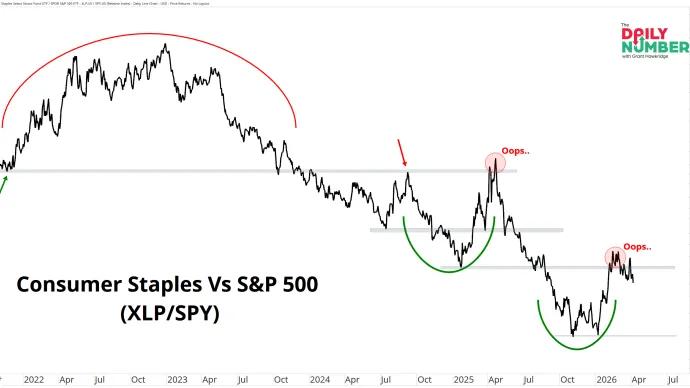
Grant Hawkridge Staples Tried to Take Control. They Failed. 📉 Today's number is... 0.123The Consumer Staples vs S&P 500 ratio sits at 0.123, near its lowest level since early February.Here’s the chart: Let's break down what the chart shows:... April 8, 2026 The Daily Number Grant
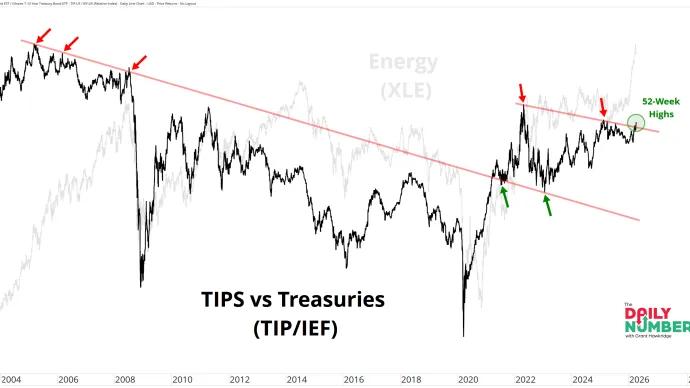
Grant Hawkridge Inflation Expectations Are Waking Up 📈 Today's number is... 1.17The ratio of inflation-protected Treasury bonds vs. 7–10 year Treasury bonds just reached 1.17 as it pushes to fresh 52-week highs.Here’s the chart: Let's break down... April 7, 2026 The Daily Number Grant
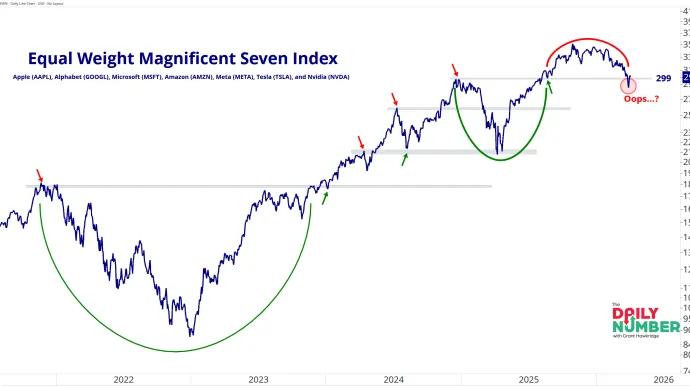
Grant Hawkridge The Breakdown That Didn’t Stick 🤨 Today's number is... 299299 was the breakdown level for the Magnificent Seven. But the market just reclaimed it.Here’s the chart: Let's break down what the chart shows:... April 6, 2026 The Daily Number Grant
Grant Hawkridge The Cycle Missed Q1 📉 Today's number is... 10One quarter of the year is finished, and the S&P 500 sits at –3.9% for 2026 so far.Here’s the chart: Let's break down what the chart shows:... April 2, 2026 The Daily Number Grant
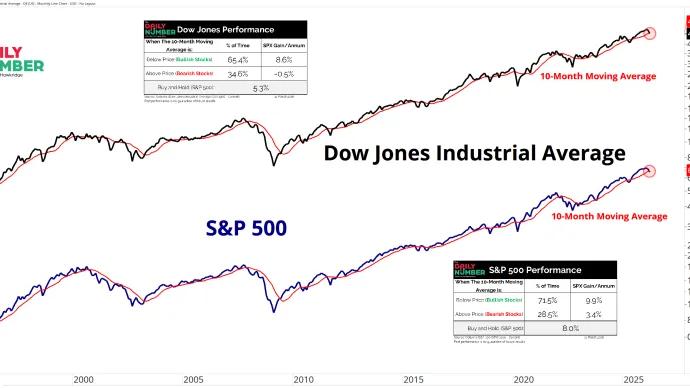
Grant Hawkridge The 10-Month Trend Just Broke 📉 Today's number is... 10The S&P 500 and the Dow Jones closed below their 10-month moving averages at the end of March.Here’s the chart: Let's break down what the chart shows:... March 31, 2026 The Daily Number Grant
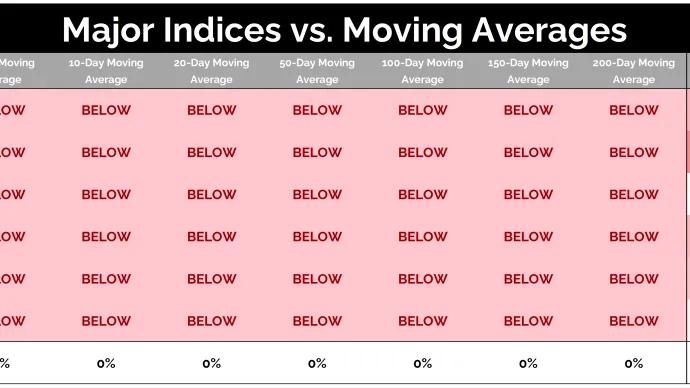
Grant Hawkridge Every Trend Has Broken 📉 Today's number is... 0%Not one of the six major US stock indexes I track is trading above any major moving average.Here’s the table: Let's break down what the table shows:... March 31, 2026 The Daily Number Grant
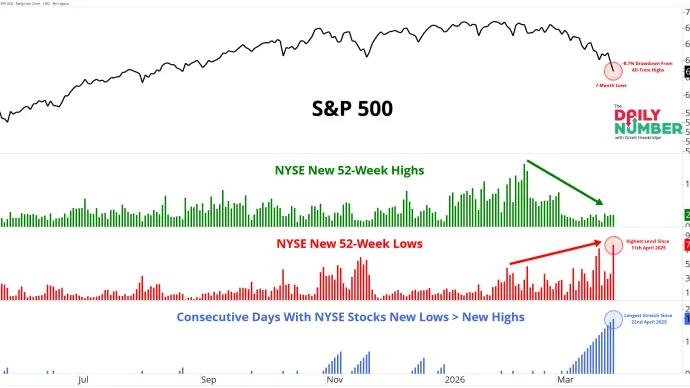
Grant Hawkridge New Lows Are Taking Over 📉 Today's number is... 17NYSE stocks have recorded 17 consecutive days where new lows exceeded new highs.Here’s the chart: Let's break down what the chart shows:... March 30, 2026 The Daily Number Grant
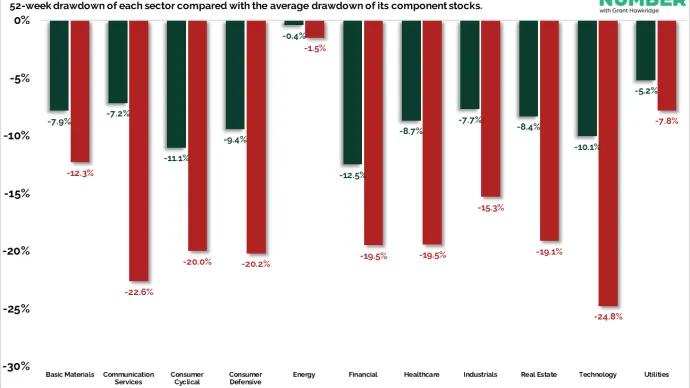
Grant Hawkridge The Damage Is Worse Than the Index Shows 📉 Today's number is... -24.8%The average Technology stock is down -24.8% from its 52-week high, already deep in bear market territory. Look across the chart and the same damage is showing up... March 26, 2026 The Daily Number Grant
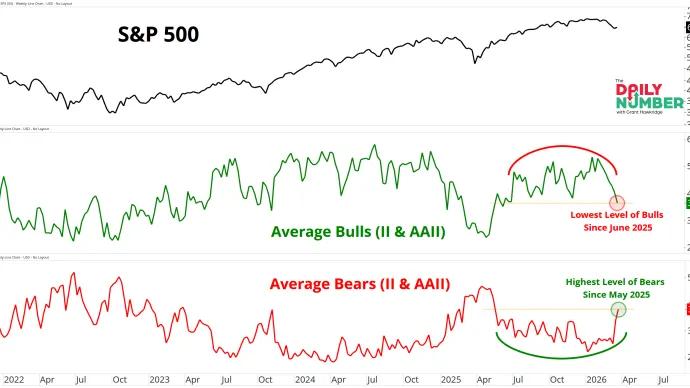
Grant Hawkridge Bears Have the Lead 🐻 Today's number is... 38.1%Average bearish sentiment just climbed to 38.1%, the highest reading since May 2025.Here’s the chart: Let's break down what the chart shows:... March 25, 2026 The Daily Number Grant
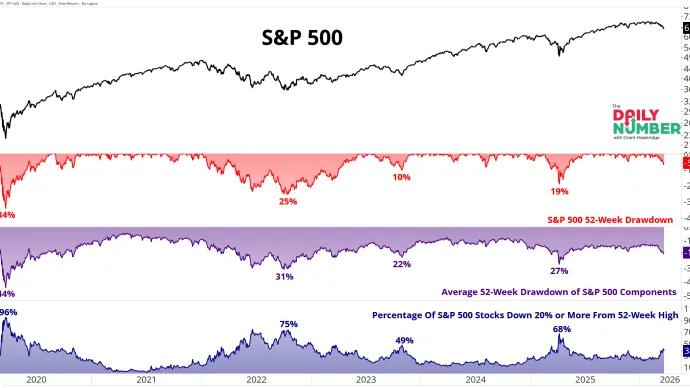
Grant Hawkridge More Than One Third of the Market Is in a Bear Market 📉 Today's number is... 38.4%38.4% of S&P 500 stocks are down 20% or more from their 52-week highs.Here’s the chart: Let's break down what the chart shows:... March 24, 2026 The Daily Number Grant
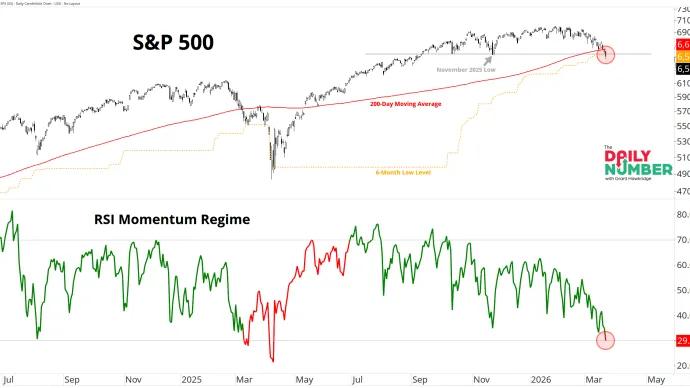
Grant Hawkridge RSI Breaks 30, Regime Turns Bearish 📉 Today's number is... 29.9The S&P 500’s 14-day RSI just dropped below 30 and now sits at 29.9, flipping the RSI Momentum Regime to bearish.Here’s the chart: Let's break down what the chart... March 23, 2026 The Daily Number Grant
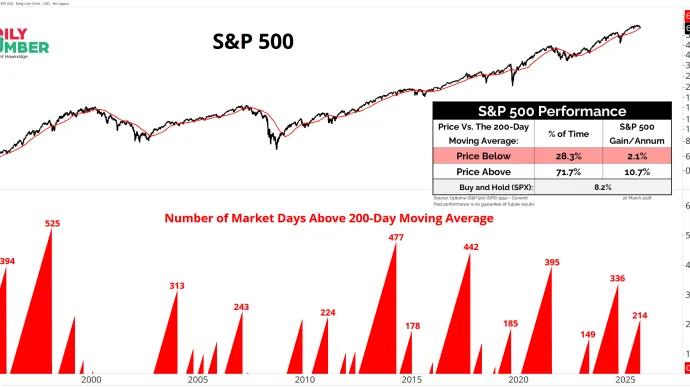
Grant Hawkridge The Streak Just Snapped 📉 Today's number is... 214The S&P 500 just ended a 214-day streak above its 200-day moving average.Here’s the chart: Let's break down what the chart shows:... March 20, 2026 The Daily Number Grant