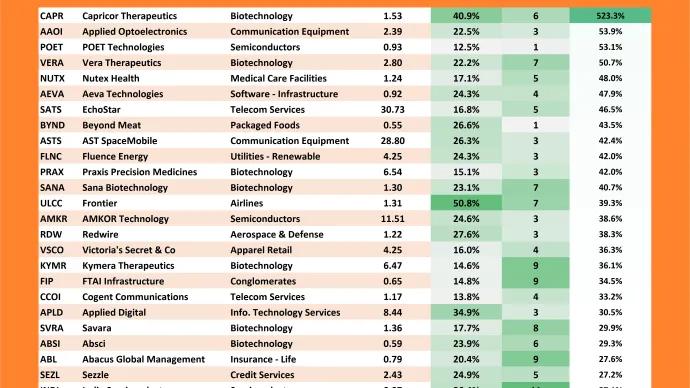
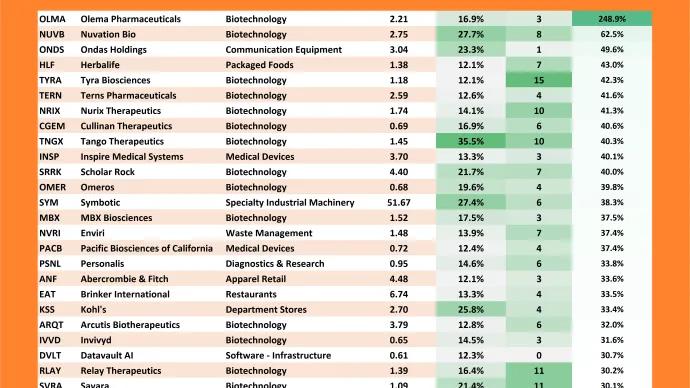
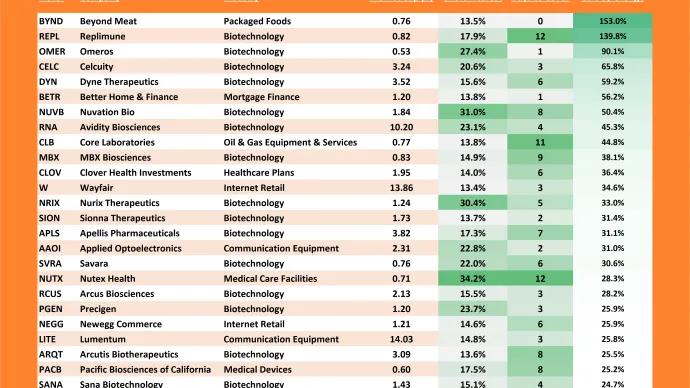
We love our bottoms-up scans here at All Star Charts. We tend to get really creative when making new universes as we want to be sure they will deliver us the best opportunities the market has to...
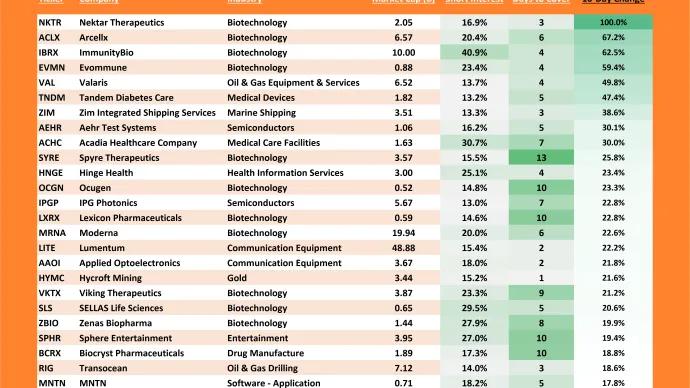
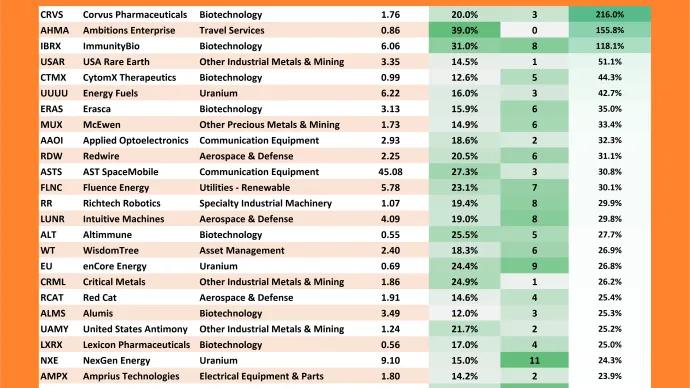
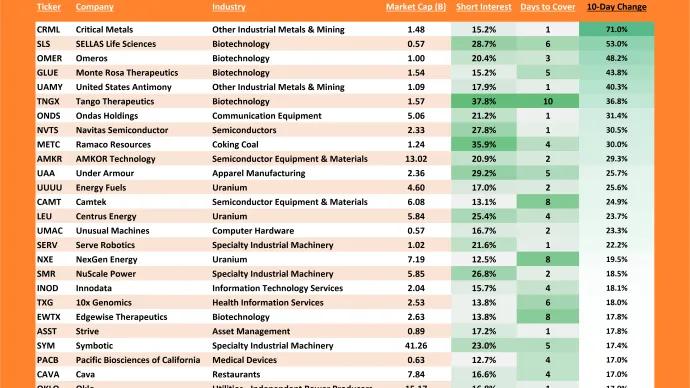
A fresh rate cut ignited risk appetite everywhere, and the momentum is feeding on itself.
Markets finally got the catalyst they’d been waiting for.
The Federal Reserve cut rates yesterday, and the reaction was immediate: shorts scrambling, risk assets ripping, and a full-blown squeeze that’s only accelerating today....
We love our bottoms-up scans here at All Star Charts. We tend to get really creative when making new universes as we want to be sure they will deliver us the best opportunities the market has to...
We love our bottoms-up scans here at All Star Charts. We tend to get really creative when making new universes as we want to be sure they will deliver us the best opportunities the market has to...
We love our bottoms-up scans here at All Star Charts. We tend to get really creative when making new universes as we want to be sure they will deliver us the best opportunities the market has to...
We love our bottoms-up scans here at All Star Charts. We tend to get really creative when making new universes as we want to be sure they will deliver us the best opportunities the market has to...
We love our bottoms-up scans here at All Star Charts. We tend to get really creative when making new universes as we want to be sure they will deliver us the best opportunities the market has to...
We love our bottoms-up scans here at All Star Charts. We tend to get really creative when making new universes as we want to be sure they will deliver us the best opportunities the market has to...
Washington isn’t leaving this one to the free market.
When it comes to the metals that power the clean energy transition and AI - lithium, nickel, cobalt, and rare earths - governments around the world have decided these resources are...
We love our bottoms-up scans here at All Star Charts. We tend to get really creative when making new universes as we want to be sure they will deliver us the best opportunities the market has to...
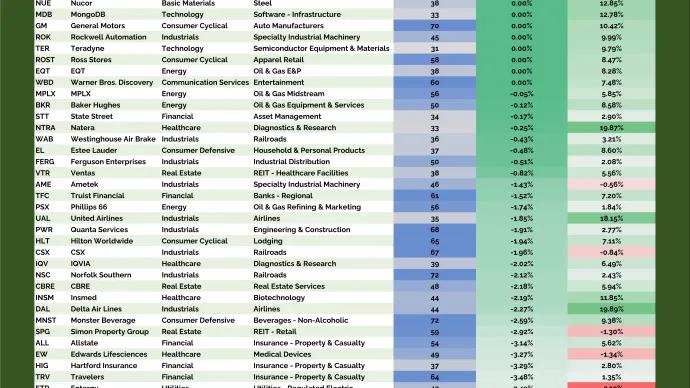
Every week, we break down the Commitment of Traders (COT) Report to see how commercial hedgers - the so-called “smart money” in the futures markets - are positioning across asset classes.
We love our bottoms-up scans here at All Star Charts. We tend to get really creative when making new universes as we want to be sure they will deliver us the best opportunities the market has to...