The way to make money in dividend stocks is not to buy the stocks that pay high dividends. That’s actually one of the best ways to lose money in dividend stocks
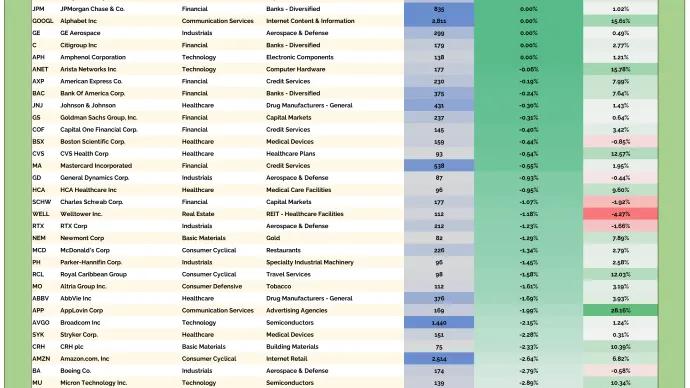
We love our bottoms-up scans here at All Star Charts. We tend to get really creative when making new universes as we want to be sure they will deliver us the best opportunities the market has to...
We love our bottoms-up scans here at All Star Charts. We tend to get really creative when making new universes as we want to be sure they will deliver us the best opportunities the market has to...
Louis just published a note with our updated Global ETF Power Rankings.
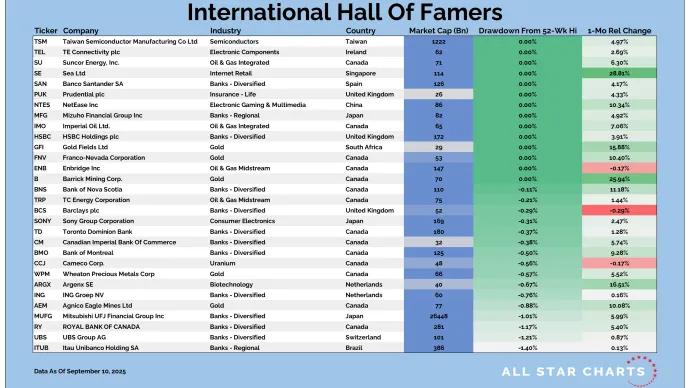
This is always one of my favorite universes to explore, but it’s especially true right now, with participation spreading across international equity...