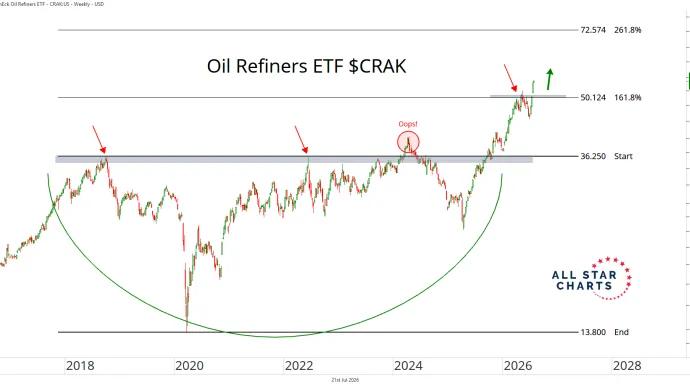
The analyst team is serving up all kinds of scans these days. Technical scans, fundamental scans, sentiment scans, a little bit of everything. These guys are really having a blast.
But they are just trying to make the most out of this bull market. They know how this works.
So, we’ve been scanning for speculative growth, international leadership, mega trends, rotation extremes, fading analysts and short-sellers,… we’ve even been running scans on warrants.
We’re going to keep sharing more and more of them each week.
But the scan of the week has to be the Matt Warder-inspired Metals, Mining & Minerals Leaderboard.
Matt has become a dear friend of All Star Charts over the years and was just with us a few weeks ago out in New Orleans. We are truly blessed as Matt has some of the deepest knowledge of natural resource stocks of anyone in the business, with a focus on minerals.
When he came on the Morning Show the other day, he dropped as much alpha in 30 minutes as any guest ever has. We must...
In this scan, we look to identify the strongest growth stocks as they climb the market-cap ladder from small- to mid- to large- and, ultimately, to mega cap status (over $200B).
Once they graduate from small-cap to mid-cap status (over $2B), they come on our radar. Likewise, when they surpass the roughly $30B mark, they roll off our list.
But the scan doesn't just end there.
We only want to look at the strongest growth industries in the market, as that is typically where these potential 50-baggers come from.
Some of the best performers in recent decades – stocks like Priceline, Amazon, Netflix, Salesforce, and myriad others – would have been on this list at some point during their journey to becoming the market behemoths they are today.
When you look at the stocks in our table, you'll notice we're only focused on Technology and Growth industry groups such as Software, Semiconductors, Online...
One of the best parts about building a trading community isn’t just sharing my own ideas—it’s seeing others take those ideas and make them even better.
Case in point: Yesterday, I closed out a call calendar spread in $AVGO for a solid win. The trade worked—price moved up into my strikes, and I took the profit. Mission accomplished.
But then a member of my All Star Options community shared what he did instead… and honestly, it might’ve been the better play.
Here’s what he wrote:
“I couldn’t bring myself to fully exit AVGO given the price action and breakout over the December highs, so I closed the short position, paid for it by selling a portion of the longs, plus enough more to put me in free ride mode, guaranteeing a 30% gain. What remains is currently double the buy-in for the original spread…”
Brilliant.
Instead of just locking in the profit like I did, he saw continued momentum and structured a creative way to both guarantee a gainand keep a position on for more upside—all while removing his risk....
I love finding stocks that are under the radar, but are starting to get noticed, quietly. That's what my team's Under the Hood report uncovers, and today's trade comes from the most recent release.
We're getting involved early, before the masses catch on and send this stock back to yearly highs, which would be a nice ride from here.
It’s forex trader lingo for the Norwegian Krone/Swedish Krona… and right now this obscure cross is setting up for a classic failed breakdown.
After undercutting key support in early May, it’s snapping back toward this level now. And with each passing day, it’s looking more and more like a bear trap.
We’re not just writing about this unheard-of FX pair to amuse you. Believe it or not, the currency pair carries valuable insights.
It’s one of our most trusted intermarket energy whisperers.
So it's no surprise the scoop-n-score setup in the NOK/SEK looks almost identical to the one in Crude Oil Futures:
Crude is working on its own bear trap — carving out a tactical reversal pattern just below a shelf of former support.
In trading, most of us chase systems, setups, signals, and edge. And while all of those matter, they pale in comparison to this one truth:
We don’t see the market as it is—we see it as we are.
Every chart we analyze, every trade we take, every hesitation we feel… it’s all colored by our own internal filters: our fears, hopes, beliefs, memories, and projections.
What we think is a battle with the market is often just a conversation with ourselves.
This is the Inner Market.
And if you’ve ever wondered why it’s so hard to “just follow your plan,” or why you keep making the same mistakes even when you know better—it’s probably not because of your strategy. It’s because of your relationship with yourself.
That’s why I’m incredibly excited to be hosting a live conversation with Andrew Menaker, PhD—a renowned trading psychologist who’s spent many years working with professional traders to help them build self-awareness, self-trust, and psychological resilience.
That’s the intermarket theory and order I’m familiar with for commodities.
Jason and the guys at Gold Rush do a great job of covering intermarket relationships and what they all mean.
They’ve been all over these commodity trends all year. Some have been great, like gold. Others are messy, like copper. And some downright bad, like crude. It’s been a mixed bag to say the least.
But today, all the buzz is about silver. It’s having its best day of the year as it rips higher out of a bull flag.
Our volatility squeeze indicator suggests a big move is brewing, and there is plenty of runway considering the pattern hasn’t even broken out yet. 35.25...
Gold quietly builds momentum, breaks out to new highs, and suddenly the whole world starts paying attention.
Then Silver wakes up violently.
And the miners? They go vertical.
This playbook isn’t new. It’s just unfolding again.
Right now, Gold is trading at all-time highs, Silver is coiling under decade-long resistance, and Silver miners are showing early signs of a major trend reversal relative to the underlying commodity.
The stage is set, and the next act could be explosive.
We've had some great trades come out of this small-cap-focused column since we launched it back in 2020 and started rotating it with our flagship bottom-up scan, Under the Hood.
For the first year or so, we focused only on Russell 2000 stocks with a market cap between $1 and $2B.
That was fun, but we wanted to branch out a bit and allow some new stocks to find their way onto our list.
We expanded our universe to include some mid-caps.
Nowadays, to make the cut for our Minor Leaguers list, a company must have a market cap between $1 and $4B.
And it doesn't have to be a Russell component — it can be any US-listed equity. With participation expanding around the globe, we want all those ADRs in our universe.
The same price and liquidity filters are applied. Then, as always, we sort by proximity to new...