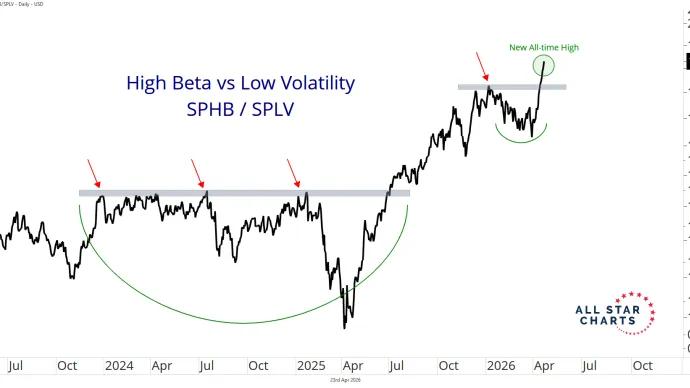
Today's trade is in an ETF on a beaten down crypto that is unlikely not to participate if the signs of a broader turnaround in the crypto space are indeed to be heeded.
These financial and healthcare stocks are breaking out after crushing the market's expectations.
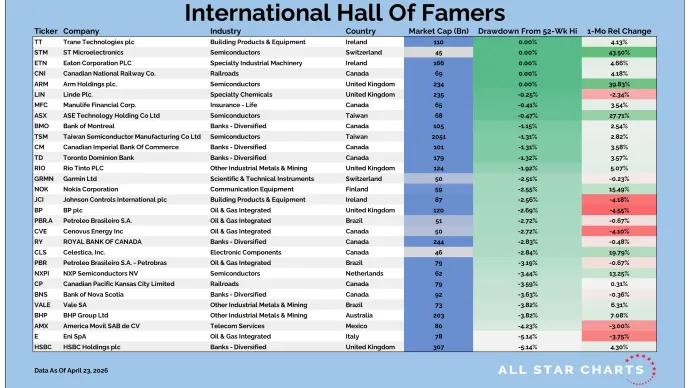
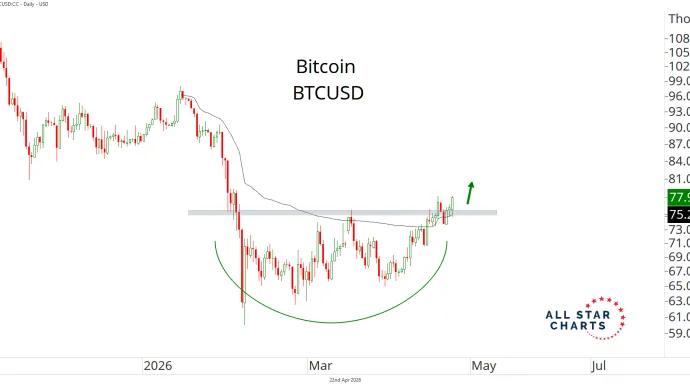
The market finally blinked.
After ripping to fresh all-time highs in one of the most relentless advances we’ve seen in years, the S&P 500 took a breather yesterday with its largest down day since the late-March bottom.
The All Star Options newsletter is completely AI-Free. Not a word you will read here was generated by an LLM. All words are typed by my boney, imperfect fingers, as a translation of thoughts from my wildly imperfect brain. Trading is messy,...