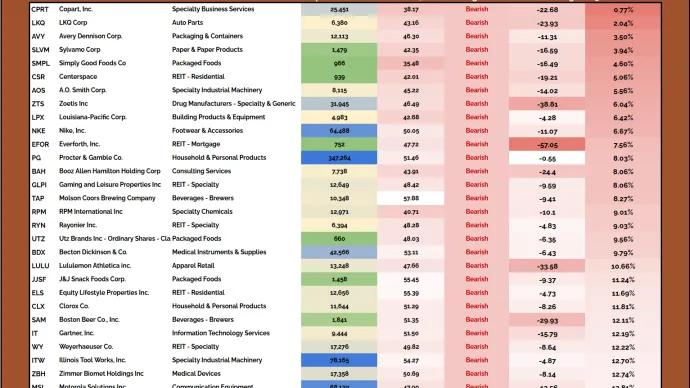
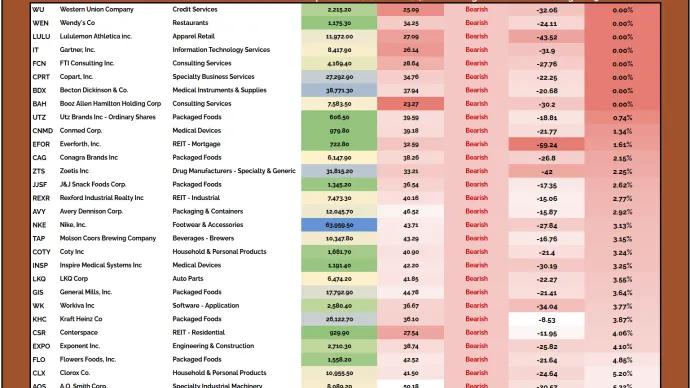
Steve Strazza The Short Report From the Desk of Steve Strazza @SstrazzaWhen investing in the stock market, we always want to approach it as "a market of stocks."Regardless of the environment, there are always stocks showing... July 21, 2026 All Star Charts Premium Short Report ASC Premium Members Only
Steve Strazza Top Down Trade of the Week Refiners lead the rebound in energy stocks Welcome back for another Top Down Trade of the Week.This is a classic leadership scan.We start with the best sectors, then drill into the subgroups. We pick one, and then take a look at... July 18, 2026 All Star Charts Premium Strazza ASC Premium Stocks Top Down Trade Of The Week Members Only
Ricardo Sarraf 2 to 100 Club Monthly Members Call - July 2026 Hey 2-to-100 Club,Today's strategy session had a guest spot: Dylan Tanen. He's a core member of our analyst team here at All Star Charts and a good friend. He joined to walk through what he's seeing across the intermarket landscape... July 17, 2026 2 to 100 Club 2-to-100 Club Premium ASC Stocks Ricardo Sarraf Video Members Only
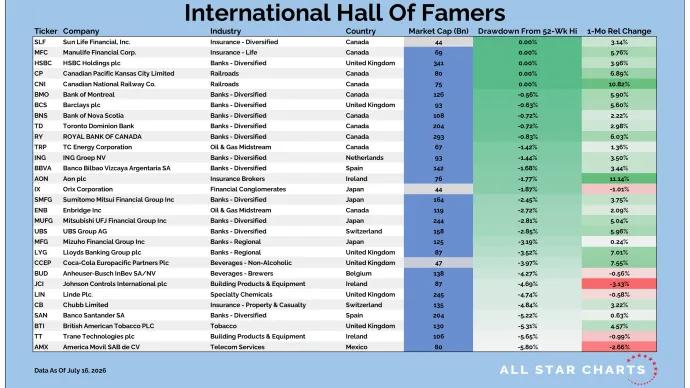
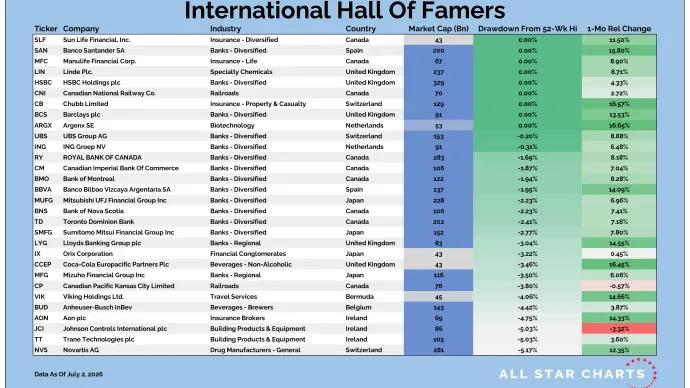
Steve Strazza International Hall of Famers From the desk of Steve Strazza @SstrazzaOur International Hall of Famers list is composed of the 100 largest US-listed international stocks, or ADRs.We've also sprinkled in some of the largest ADRs... July 17, 2026 All Star Charts Premium Strazza Stocks Premium ASC International Hall Of Famers Members Only
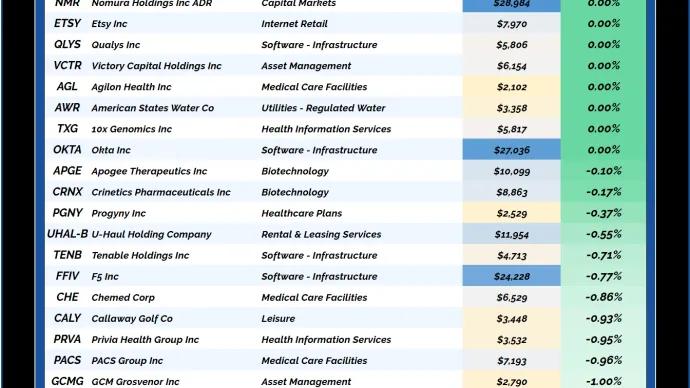
Ricardo Sarraf 2 to 100 Club From the desk of Ricardo Sarraf @nullchartsEvery cycle produces a handful of stocks that go from emerging to enormous — names that compound 10x, 20x, 50x before they become portfolio fixtures. But they... July 15, 2026 2 to 100 Club All Star Charts Premium 2-to-100 Club Premium ASC Stocks Ricardo Sarraf Members Only
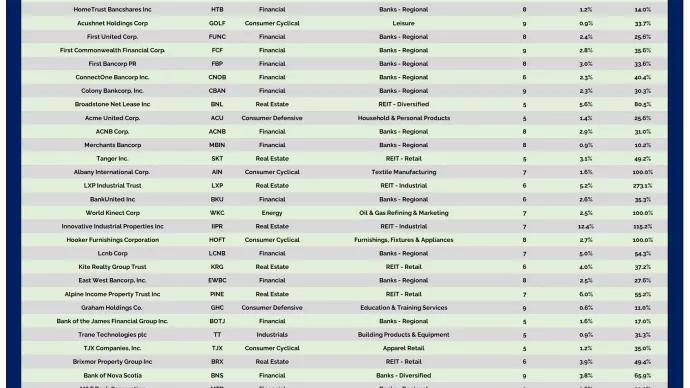
Steve Strazza The Minor Leaguers From the Desk of Steve Strazza @SstrazzaWelcome to The Minor Leaguers.We've had some great trades come out of this small-cap-focused column since we launched it back in 2020 and... July 13, 2026 All Star Charts Premium Minor Leaguers ASC Stocks Steve Strazza Premium Small Caps Members Only
Steve Strazza Top Down Trade of the Week This train is on track for new highs Welcome back for another Top Down Trade of the Week.This is a classic leadership scan.We start with the best sectors, then drill into the subgroups. We pick one, and then take a look at... July 11, 2026 All Star Charts Premium Strazza ASC Premium Stocks Top Down Trade Of The Week Members Only
Ricardo Sarraf 2 to 100 Club Welcome Members Call - July 2026 Hey guys. Today we welcomed a lot of new 2-to100 Club members. We covered a lot, so here's the short version:... July 10, 2026 2 to 100 Club 2-to-100 Club Premium ASC Stocks Ricardo Sarraf Video Education Members Only
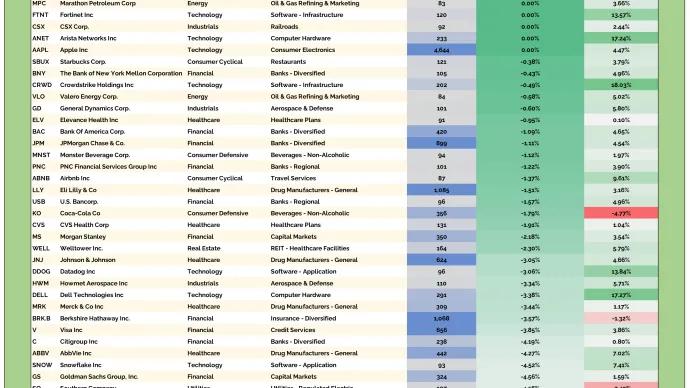
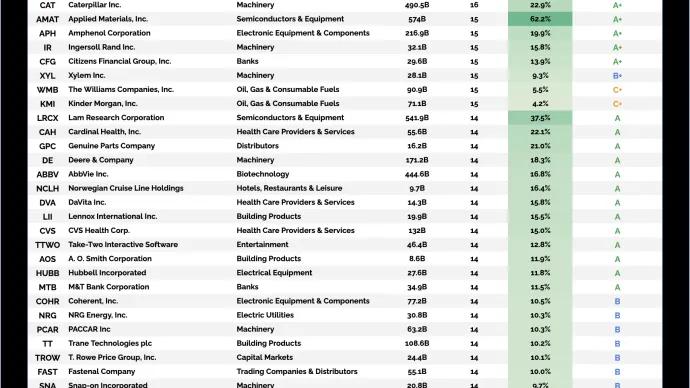
Steve Strazza The Hall of Famers From the desk of Steve Strazza @SstrazzaOur Hall of Famers list is composed of the 150 largest US-based stocks.These stocks range from the mega-cap growth behemoths like Apple and Microsoft – with... July 10, 2026 All Star Charts Premium Stocks Hall Of Famers ASC Premium Strazza Members Only
Ricardo Sarraf 2 to 100 Club From the desk of Ricardo Sarraf @nullchartsEvery cycle produces a handful of stocks that go from emerging to enormous — names that compound 10x, 20x, 50x before they become portfolio fixtures. But they... July 8, 2026 2 to 100 Club All Star Charts Premium 2-to-100 Club Premium ASC Stocks Ricardo Sarraf Members Only
Steve Strazza Ricardo Sarraf The Short Report From the Desk of Steve Strazza @SstrazzaWhen investing in the stock market, we always want to approach it as "a market of stocks."Regardless of the environment, there are always stocks showing... July 7, 2026 All Star Charts Premium Short Report ASC Premium Ricardo Members Only
Steve Strazza Top Down Trade of the Week Buying an insurance leader Welcome back for another Top Down Trade of the Week.This is a classic leadership scan.We start with the best sectors, then drill into the subgroups. We pick one, and then take a look at... July 4, 2026 All Star Charts Premium Strazza ASC Premium Stocks Top Down Trade Of The Week Members Only
Steve Strazza International Hall of Famers From the desk of Steve Strazza @SstrazzaOur International Hall of Famers list is composed of the 100 largest US-listed international stocks, or ADRs.We've also sprinkled in some of the largest ADRs... July 3, 2026 All Star Charts Premium Strazza Stocks Premium ASC International Hall Of Famers Members Only
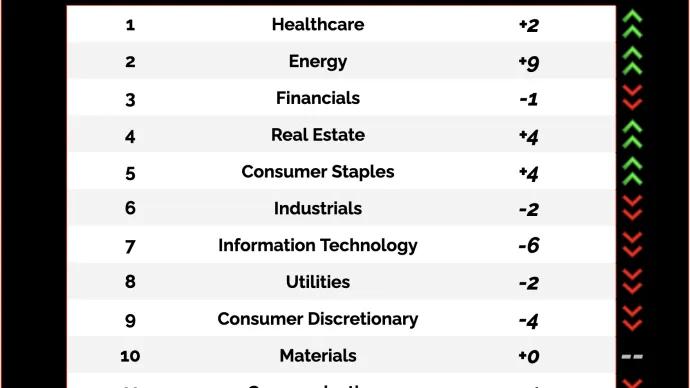
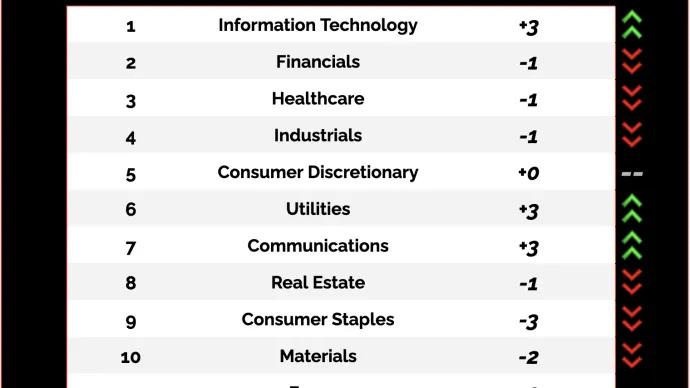
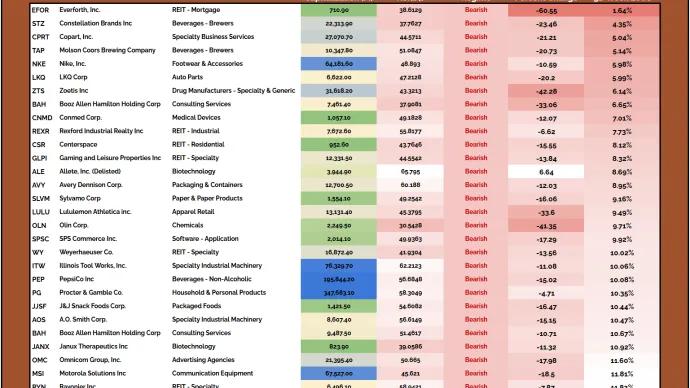
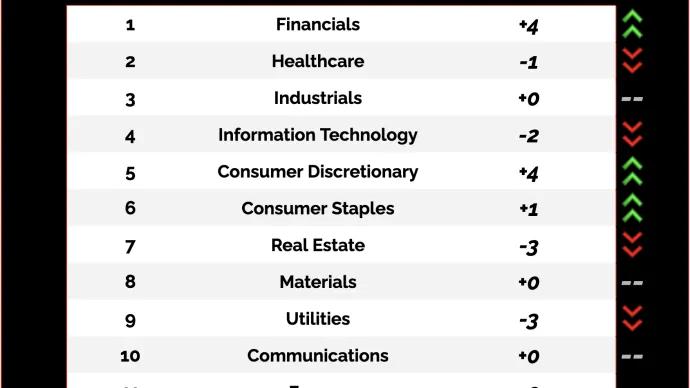
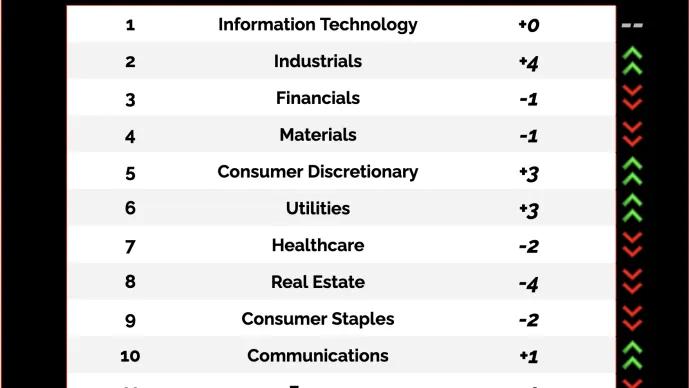
Steve Strazza The Top Stocks of June The big story in June was rotation. After months of narrow breadth, the market finally broadened out and the new leaders aren't the same names from Q1… or even April. Industrials took the baton and... July 2, 2026 All Star Charts Premium ASC Strazza Premium Top Stocks Of The Month Members Only
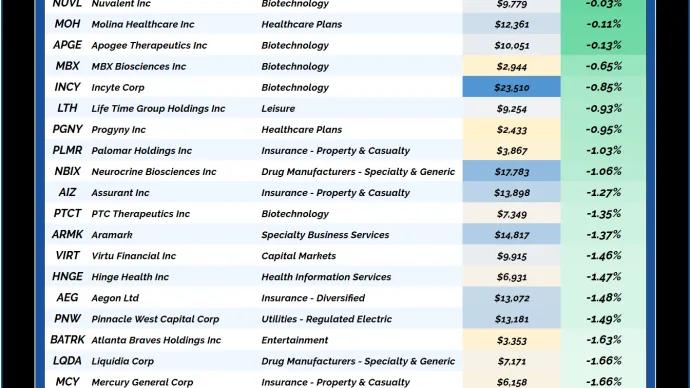
Steve Strazza Baker Bros Special Report With money flowing into healthcare, biotech is breaking out and emerging as one of the most attractive areas in the market.When it comes to biotech investing, no one commands more respect than Felix and Julian Baker.... July 1, 2026 All Star Charts Premium ASC Stocks Steve Strazza Premium Special Report Members Only
Ricardo Sarraf 2 to 100 Club, 4th of July Special Hey everyone. I put together two reports with my team that I think you'll get a lot out of.The first one breaks down how to read a mid-cap scan entry from scratch, so you can look at any setup we publish and know exactly what you're... July 1, 2026 2 to 100 Club All Star Charts Premium 2-to-100 Club Premium ASC Stocks Ricardo Sarraf Members Only
Ricardo Sarraf 2 to 100 Club From the desk of Ricardo Sarraf @nullchartsEvery cycle produces a handful of stocks that go from emerging to enormous — names that compound 10x, 20x, 50x before they become portfolio fixtures. But they... July 1, 2026 2 to 100 Club All Star Charts Premium 2-to-100 Club Premium ASC Stocks Ricardo Sarraf Members Only
Steve Strazza The Minor Leaguers From the Desk of Steve Strazza @SstrazzaWelcome to The Minor Leaguers.We've had some great trades come out of this small-cap-focused column since we launched it back in 2020 and... June 29, 2026 All Star Charts Premium Minor Leaguers ASC Stocks Steve Strazza Premium Small Caps Members Only
Steve Strazza Top Down Trade of the Week Buying bases with the Baker Bros Welcome back for another Top Down Trade of the Week.This is a classic leadership scan.We start with the best sectors, then drill into the subgroups. We pick one, and then take a look at... June 27, 2026 All Star Charts Premium The Strazza Letter Strazza ASC Premium Stocks Top Down Trade Of The Week Members Only
Steve Strazza The Hall of Famers From the desk of Steve Strazza @SstrazzaOur Hall of Famers list is composed of the 150 largest US-based stocks.These stocks range from the mega-cap growth behemoths like Apple and Microsoft – with... June 26, 2026 All Star Charts Premium Stocks Hall Of Famers ASC Premium Strazza Members Only
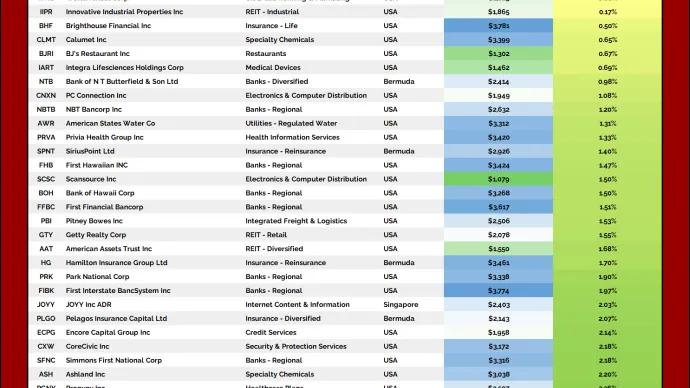
Steve Strazza Young Aristocrats (June 2026) From the desk of Steve Strazza @SstrazzaDividend Aristocrats are easily some of the most desirable investments on Wall Street. These are the names that have increased dividends for at least 25 years, providing steadily... June 26, 2026 All Star Charts Premium Young Aristocrats Dividends ASC Premium Stocks Strazza Members Only
Ricardo Sarraf 2 to 100 Club From the desk of Ricardo Sarraf @nullchartsEvery cycle produces a handful of stocks that go from emerging to enormous — names that compound 10x, 20x, 50x before they become portfolio fixtures. But they... June 24, 2026 2 to 100 Club All Star Charts Premium 2-to-100 Club Premium ASC Stocks Ricardo Sarraf Members Only
Steve Strazza Ricardo Sarraf The Short Report From the Desk of Steve Strazza @SstrazzaWhen investing in the stock market, we always want to approach it as "a market of stocks."Regardless of the environment, there are always stocks showing... June 23, 2026 All Star Charts Premium Short Report ASC Premium Ricardo Members Only
Steve Strazza Top Down Trade of the Week We're Adding Industrial Exposure Welcome back for another Top Down Trade of the Week.This is a classic leadership scan.We start with the best sectors, then drill into the subgroups. We pick one, and then take a look at... June 20, 2026 All Star Charts Premium The Strazza Letter Strazza ASC Premium Stocks Top Down Trade Of The Week Members Only