Early-year rotations are opening opportunities in soft commodities.
We’ve officially closed the books on 2025, and the scoreboard tells a very clear story.
If you were long precious metals last year, it was a feast. Silver, Platinum, Palladium, and Gold dominated the commodity complex, and it wasn’t even close....
Today is the fourth and final installment of a collection of wisdom from you, my Spirit Animals. Thank you so much for all the responses. Once they started trickling in, a stream became a flood. I'm incredibly grateful to everyone for...
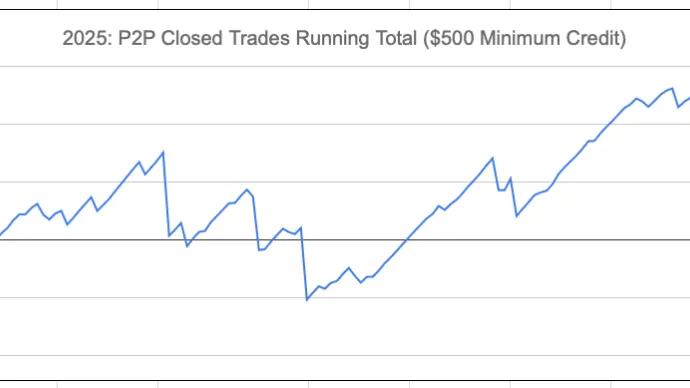
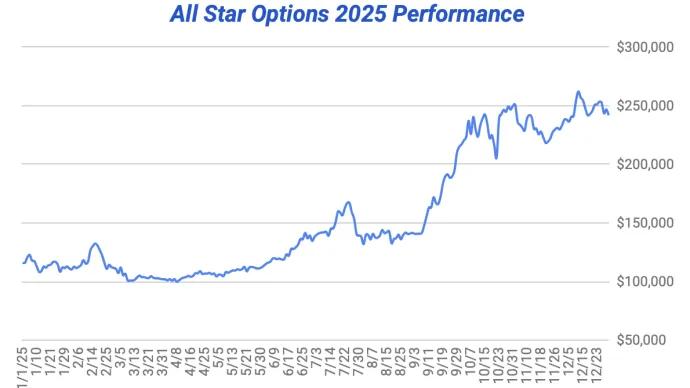
Welcome to Paid to Play -- a unique window into a live trading account we manage for the express purposes of generating cash flow and adding diversification to our portfolio of trading strategies.
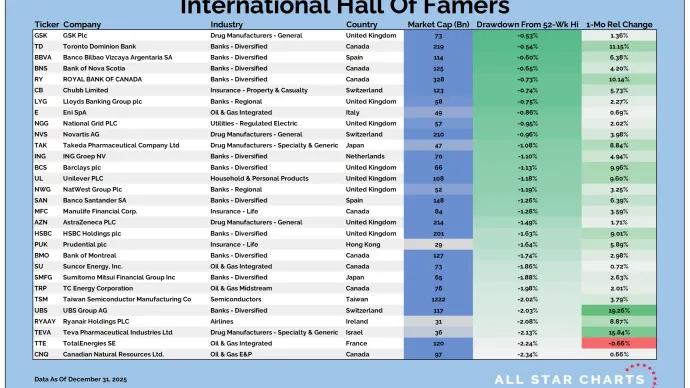
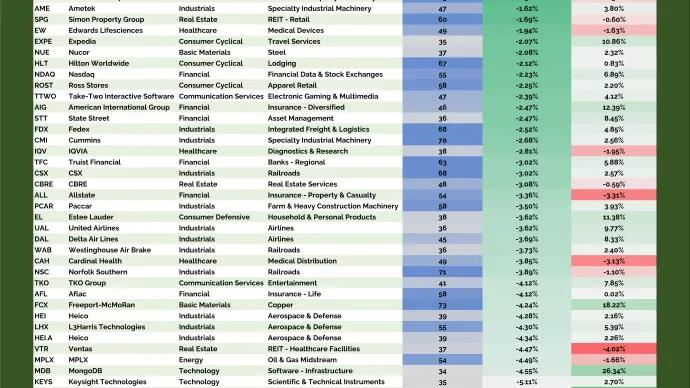
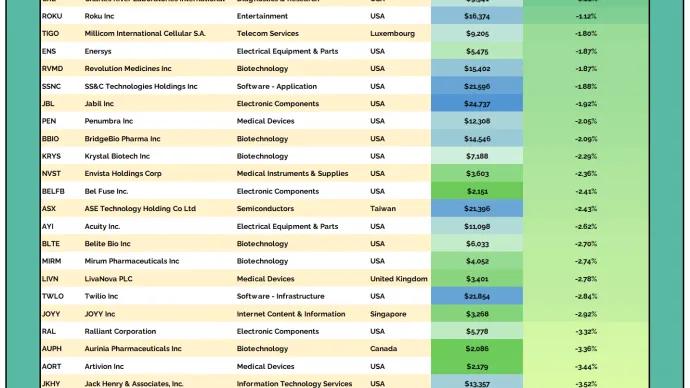
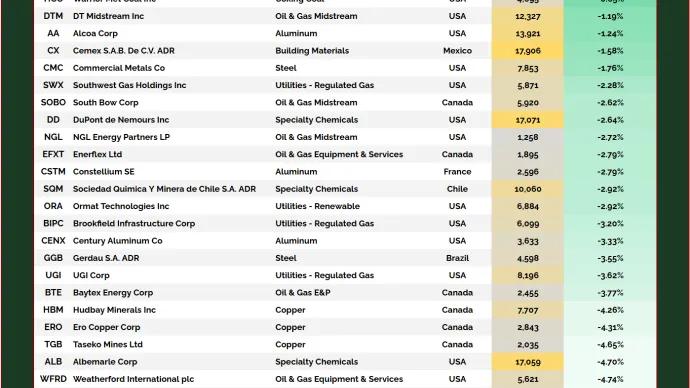
We love our bottoms-up scans here at All Star Charts. We tend to get really creative when making new universes as we want to be sure they will deliver us the best opportunities the market has to...
There's no fighting the trend of degenerate gamblers. It's here to stay.
Today's trade isn't necessarily the poster child of this movement (think DraftKings, Robinhood, Coinbase). But many of this company's customers are inflicted with the same...
Most natural resource stocks, even the bellwethers of Metals or Energy, for example, can’t scale to $3 Trillion in market cap. They’re simply not built like the juggernauts of tech or communications.