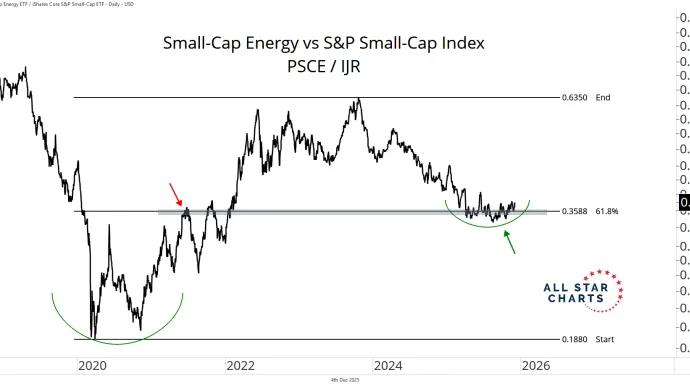
Energy is positioning itself for the next major rotation.
We’re finally seeing real strength beneath the surface. Refiners are ripping, oil services are accelerating, and the smaller names are starting to firm up as well.
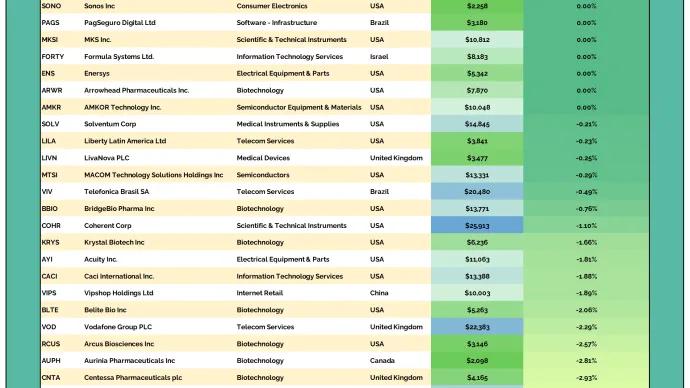
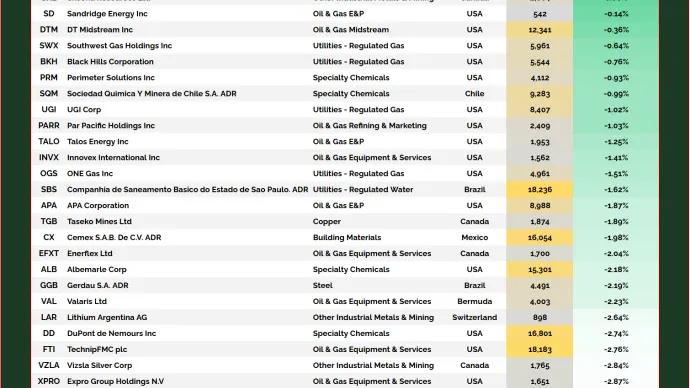
We love our bottoms-up scans here at All Star Charts. We tend to get really creative when making new universes as we want to be sure they will deliver us the best opportunities the market has to...
Today, we're getting short a stock that has been a complete mess all year.
In recent weeks, the pause has stalled just enough to tamp down the premiums in puts, making now an attractive time to position for a resumption of the downtrend.
This morning, I exited an iron condor trade in $IBIT, the Bitcoin ETF.
For those unfamiliar, an iron condor is a delta-neutral options strategy that profits when the underlying stays within a defined range. It consists of four options: selling...
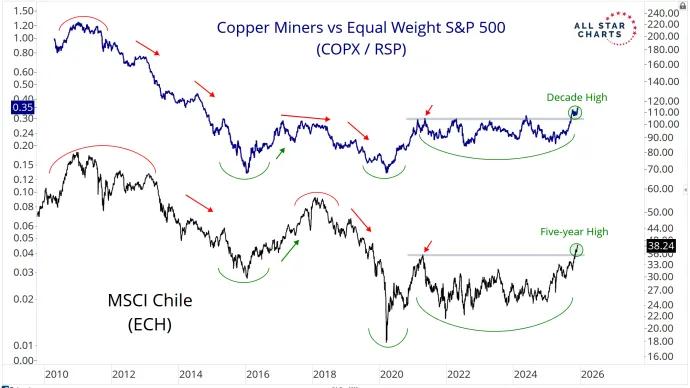
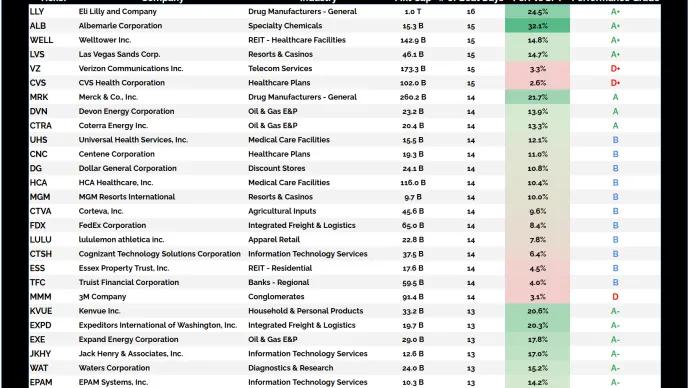
Most natural resource stocks, even the bellwethers of Metals or Energy, for example, can’t scale to $3 Trillion in market cap. They’re simply not built like the juggernauts of tech or communications.