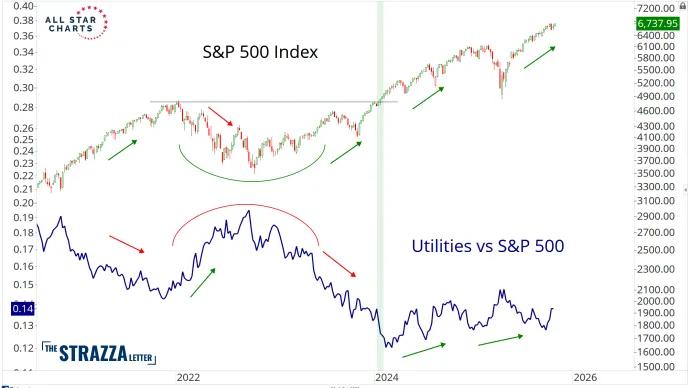
When it comes to seasonality, the best signals often appear when the market breaks from the script.That’s when we learn what’s really happening beneath the surface.Historically, August through October has been one of the toughest periods for stocks —...
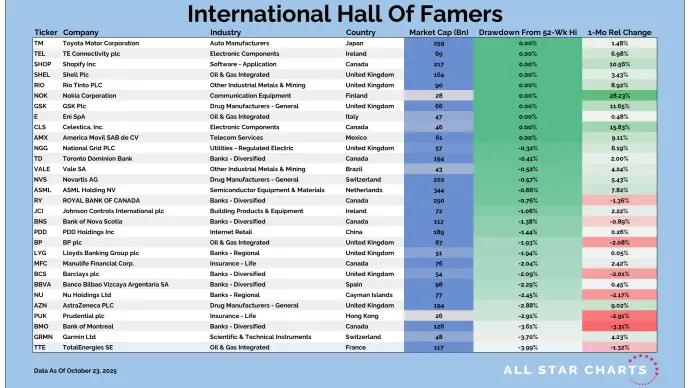
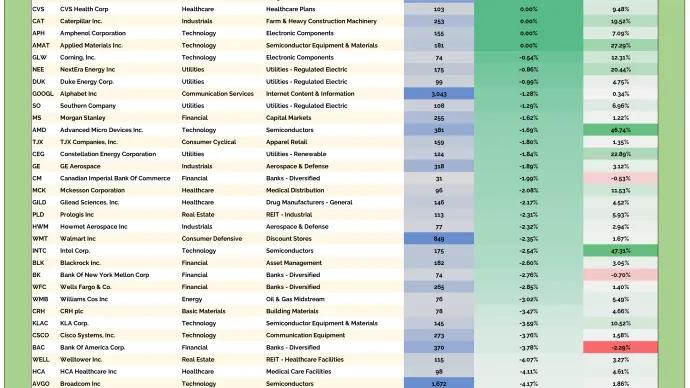
Dividend Aristocrats are easily some of the most desirable investments on Wall Street. These are the names that have increased dividends for at least 25 years, providing steadily...
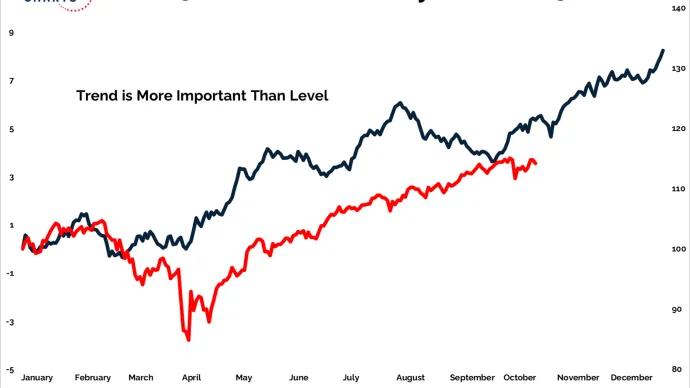
In most parts of life, the rule is simple — follow the leader.But in the bond market, the game’s a little different. Here, it’s more like carry the follower.
That’s exactly what we’re seeing play out right now between short term and...
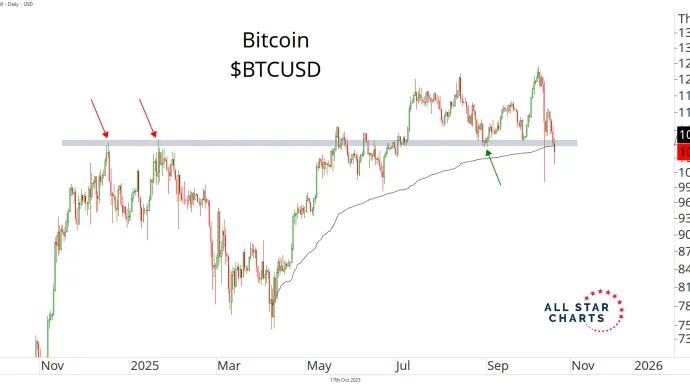
Every trader has their favorite tools — moving averages, Fibonacci, oscillators, you name it.But few are as powerful as the AVWAP.It’s the average price by volume anchored to a specific moment in time — blending price and psychology to show where the...
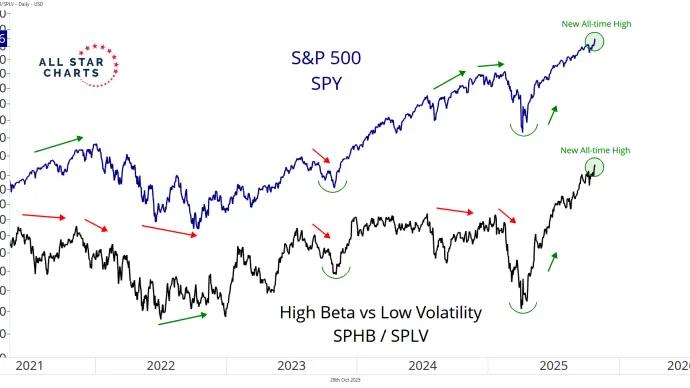
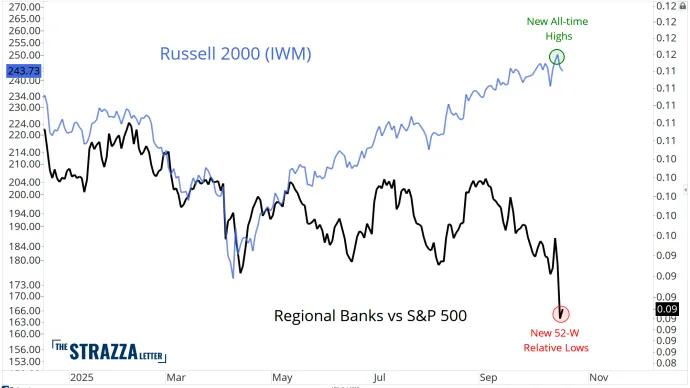
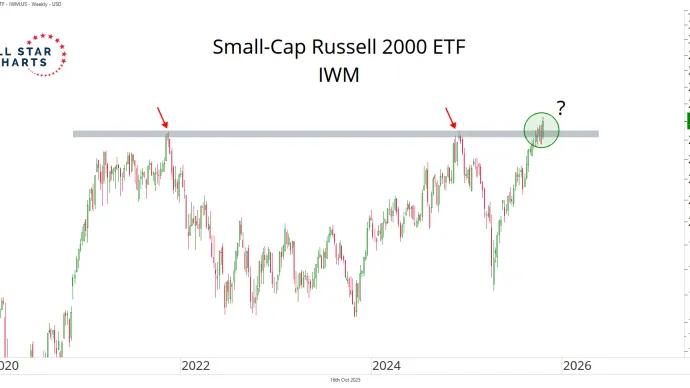
The Russell 2000 $IWM and Micro-Cap Index $IWC both printed new all-time highs earlier this week. That’s a milestone that, at first glance, speaks to growing risk appetite and broadening market strength.
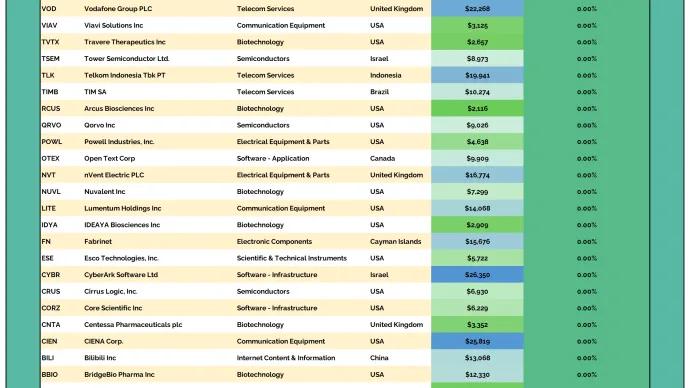
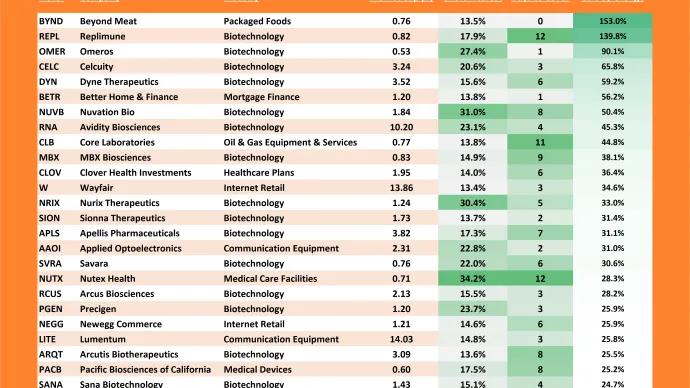
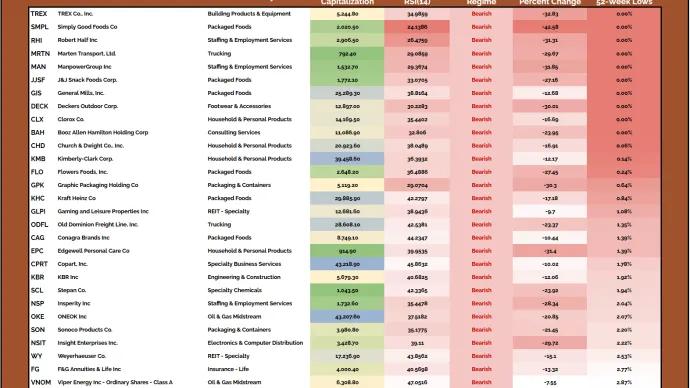
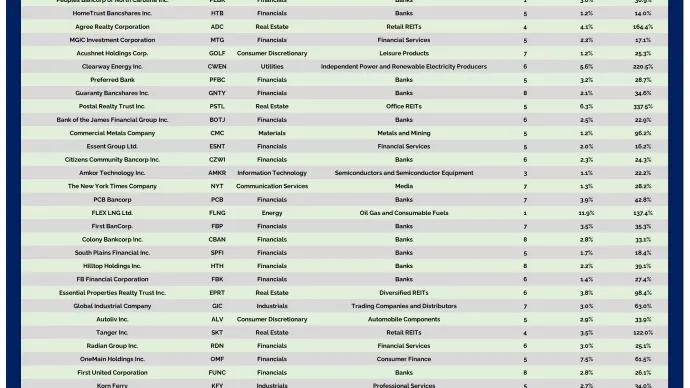
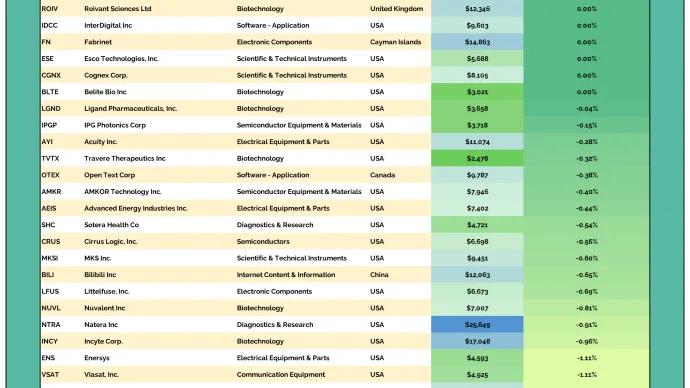
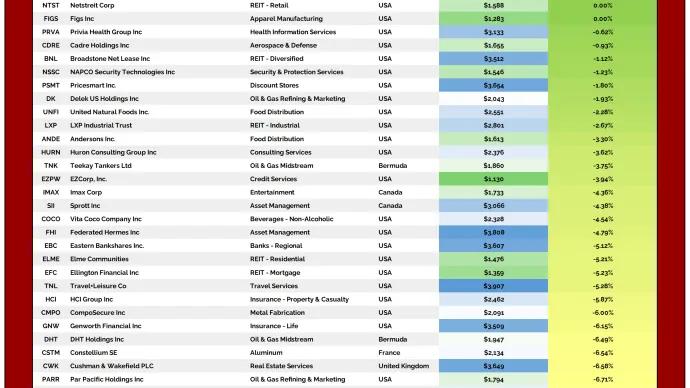
We love our bottoms-up scans here at All Star Charts. We tend to get really creative when making new universes as we want to be sure they will deliver us the best opportunities the market has to...