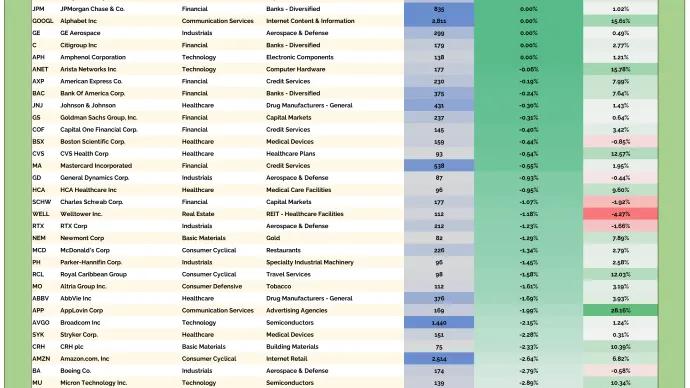
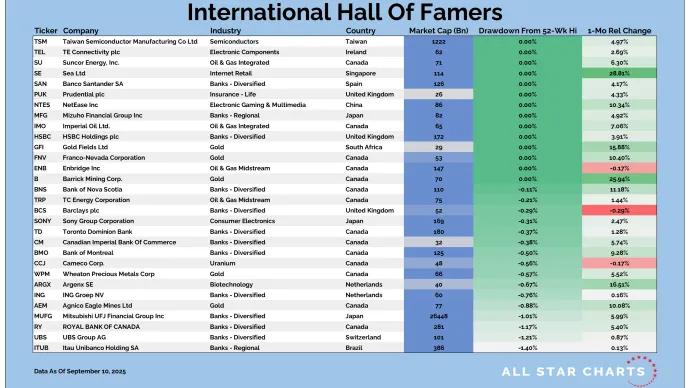
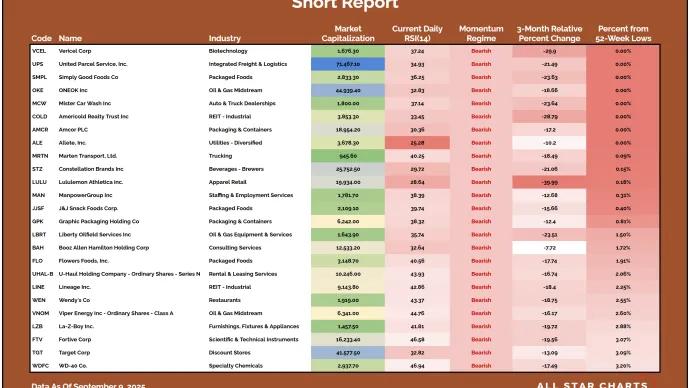
We love our bottoms-up scans here at All Star Charts. We tend to get really creative when making new universes as we want to be sure they will deliver us the best opportunities the market has to...
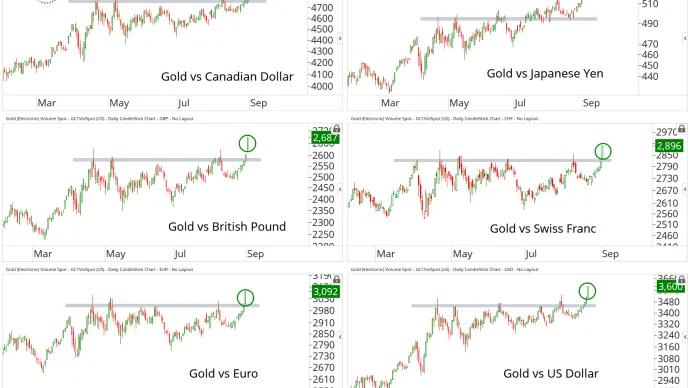
Washington isn’t leaving this one to the free market.
When it comes to the metals that power the clean energy transition and AI - lithium, nickel, cobalt, and rare earths - governments around the world have decided these resources are...
We love our bottoms-up scans here at All Star Charts. We tend to get really creative when making new universes as we want to be sure they will deliver us the best opportunities the market has to...