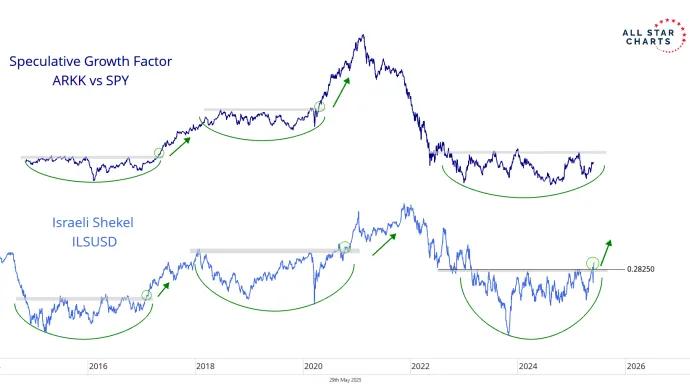
During our time in New Orleans at the Portfolio Accelerator event, I brought the Israeli Shekel to the table—and it sparked a really interesting discussion.
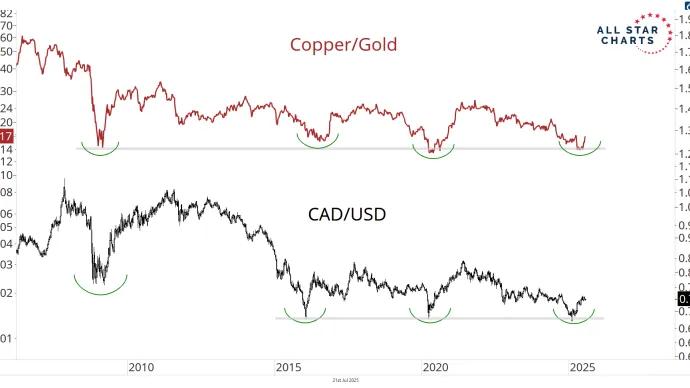
And while the CAD rarely grabs headlines like the euro, pound, or yen, it’s no backbencher—it makes up 9% of the US Dollar Index $DXY, just behind the big three.
The Mexican peso is the “blue-chip” emerging market currency. It’s long been a favorite for hedge fund carry trades—often paired with the yen—due to Mexico’s relatively high interest rates and liquid FX market....
You're overthinking the whole dollar and oil connection.
As a trader, I love finding intermarket relationships to guide the way I look at markets. While those links matter, I have to remember that they aren’t set in...
With stock market investors looking every which way at different market-moving headlines today, let's take a step back and talk about what's really important.We just got monthly candles. It's time to zoom out. And when we do, is there a chart...