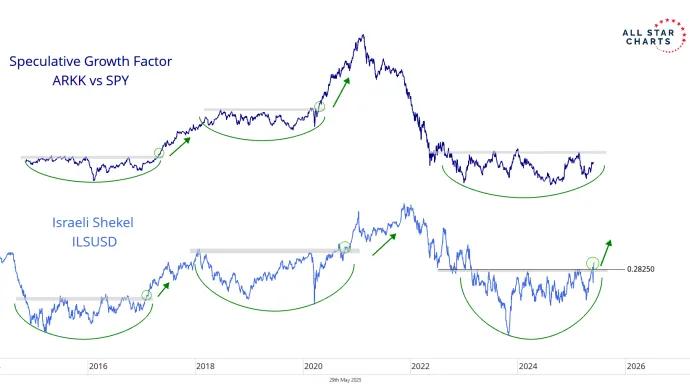
During our time in New Orleans at the Portfolio Accelerator event, I brought the Israeli Shekel to the table—and it sparked a really interesting discussion.
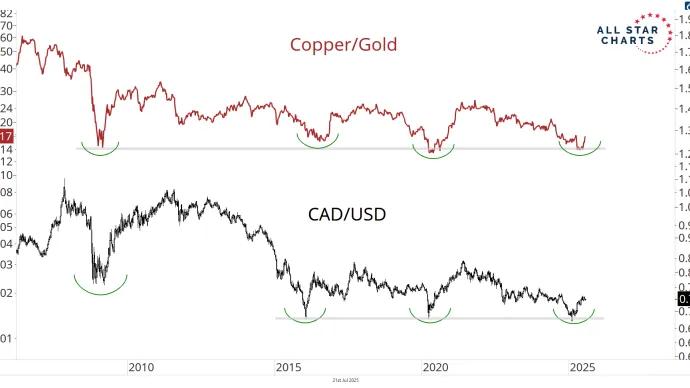
And while the CAD rarely grabs headlines like the euro, pound, or yen, it’s no backbencher—it makes up 9% of the US Dollar Index $DXY, just behind the big three.
The Mexican peso is the “blue-chip” emerging market currency. It’s long been a favorite for hedge fund carry trades—often paired with the yen—due to Mexico’s relatively high interest rates and liquid FX market....
It’s in make or break territory—either the dollar cracks here, just like it did after Trump’s last inauguration, or it holds strong and puts pressure on stocks, commodities...
You're overthinking the whole dollar and oil connection.
As a trader, I love finding intermarket relationships to guide the way I look at markets. While those links matter, I have to remember that they aren’t set in...
With stock market investors looking every which way at different market-moving headlines today, let's take a step back and talk about what's really important.We just got monthly candles. It's time to zoom out. And when we do, is there a chart...