This is the most bullish chart I’ve ever seen.The total crypto market cap, excluding Bitcoin and Ethereum, just broke to new all-time highs after four years of going nowhere.The next leg of the bull market is only just beginning.
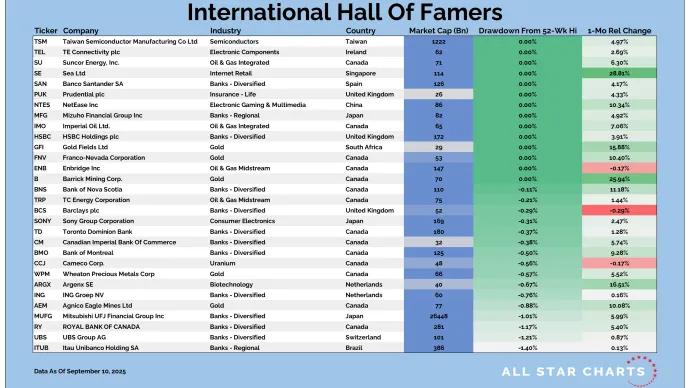
We love our bottoms-up scans here at All Star Charts. We tend to get really creative when making new universes as we want to be sure they will deliver us the best opportunities the market has to...
As many of you know, I spent the early part of this week in Toronto attending our Portfolio Accelerator event. It's two days of roundtable discussions where all the All Star Charts analysts as well as invited guests are given the floor to share their...
Sometimes the best presentations happen when you throw away the presentation.
I was supposed to give a talk at our Portfolio Accelerator event in Toronto yesterday. Had my rough outline ready, even cobbled together what I generously called a...
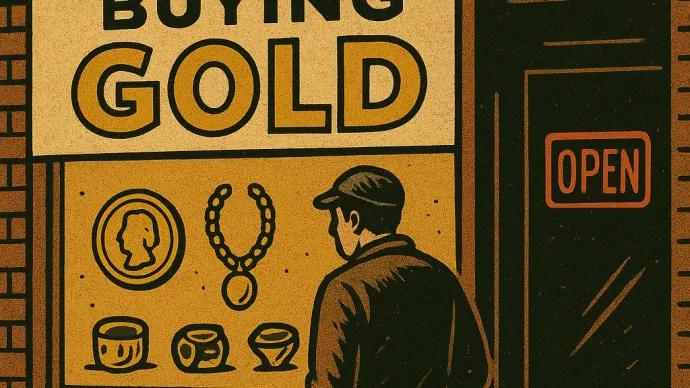
The metals sector continues to shine. And it should be no stretch of the imagination to imagine that the soaring value of gold could have downstream effects.
Might pawnshops benefit?
Today's trade is in an a pawn shop purveyor that...