Louis just published a note with our updated Global ETF Power Rankings.
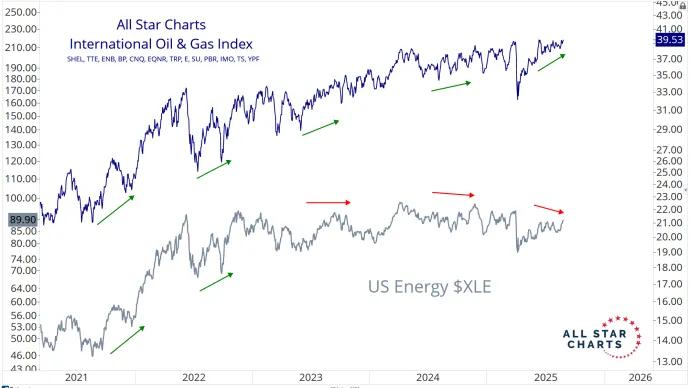
This is always one of my favorite universes to explore, but it’s especially true right now, with participation spreading across international equity...
Every week, we break down the Commitment of Traders (COT) Report to see how commercial hedgers - the so-called “smart money” in the futures markets - are positioning across asset classes.
There's a saying in crypto: slowly, then all at once.It’s a phrase that perfectly captures the market’s volatility — long stretches of quiet, then suddenly a rally that takes everyone by surprise. That’s how previous crypto cycles...