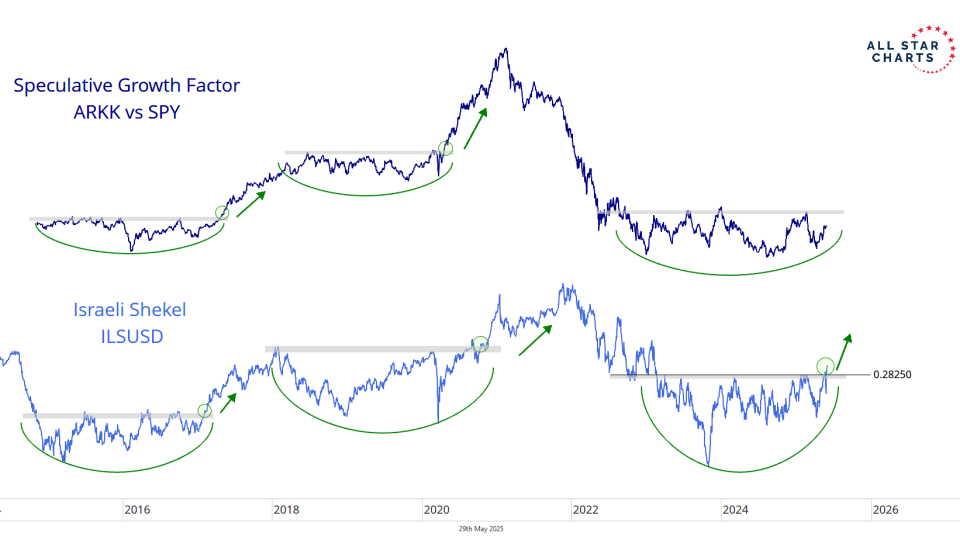
Several months ago, we discussed the blowout momentum readings for the junior gold and silver miners.
These momentum thrusts often initiate the beginning of significant trend reversals, not the end.
Since then, the price action has been lackluster. However, our technical analysis suggests that the bulls are on the cusp of stepping in and resuming the primary uptrend.
Let's delve into the charts and how we plan to profit from them.
Silver Miners $SIL are printing fresh 52-week highs relative to silver futures:
The New York Stock Exchange held its annual Tree Lighting Event this week. It was spectacular, as always.
But we're not here to talk about pine trees or LED lights. We're here to talk about commodities.
The NYSE has an array of vehicles to trade, most being equities.
They also have several commodity funds, which happen to offer asymmetric risk versus reward opportunities at current levels. Let's talk about them.
Our first setup is the Invesco DB Agriculture Fund $DBA:
The top five holdings are cocoa (14.8%), coffee (13%), live cattle (11.9%), sugar (11.6%), and corn (11.4%), several of which we've recently discussed.
My cousin wasn't asking me about crypto during this year's Thanksgiving feast.
Instead, he wanted to know which commodity to buy after the historic cocoa trade.
Without hesitation, I told him, "coffee."
And I really believe that!
Let's talk about why.
Our Soft Commodity Index is testing a critical level of interest:
The index peaked and rolled over in 2011 and has carved out a massive basing pattern in the years since then. If and when the bulls resolve this pattern, we want to be long.
On a relative basis, soft commodities are printing fresh 52-week highs versus the broader commodity complex. This is precisely what we're looking for in a leadership group, and we expect this outperformance to continue for the foreseeable future.
Cocoa futures recently resolved a 45-year base and put the bears in a dirt nap, and we think coffee futures are up next:
As you can see, coffee is at its highest level since it peaked in 1977, following a face-ripping 600% rally in two years.
A close above 340 would mark the end of a nearly 50-year consolidation and the beginning of a new uptrend.
*BREAKING NEWS* $BTC printing fresh all-time highs priced in every fiat currency is NOT bearish for gold.
We recently recorded a video with our in-house crypto analyst, Louis Sykes, to discuss the connections between bitcoin and gold.
The relationship isn't perfect, but it would be irresponsible of us as investors to ignore the correlation between 2 of the most significant hard-money assets in the world.
Bitcoin and Gold, they’ve got some things in common, but let’s not kid ourselves.
The differences are just as striking as the similarities. Sometimes they move together, other times they couldn’t be further apart. It’s a love-hate relationship, and it’s fascinating to watch.
In this video, we dive into these correlations, when Bitcoin, Gold, and even Bonds align, and when they decide to part ways.
Why does this happen, and what does it mean for traders?
Joining me is Louis Sykes, our in house crypto killer. Louis has been crushing it in the crypto markets for years, and today he’s breaking down the connections between Bitcoin and Gold. But it’s more than just charts and correlations…
We’re getting into the big picture and where Bitcoin might be headed next.
I’ve wanted to do this ever since I met Louis at our Portfolio Accelerator event in Cali. The guy’s an out of the box thinker, and this conversation didn’t disappoint.
Last week, we identified a bullish momentum divergence in the commodities versus stocks ratio at a shelf of former lows.
The evidence suggests we're on the verge of a new era of commodity outperformance.
If we're right, it's time to prepare a list of our favorite setups to seize this opportunity.
We've already covered promising setups in uranium and solar.
Now, let's focus on oil and gas, and here's why:
First, crude oil, heating oil, and gasoline have been consolidating above a shelf of former highs for more than two years, and the risk is skewed in favor of the bulls.
Until the bears can resolve these consolidations to the downside, we want to continue betting these levels hold as support.
Gold futures have been down in 6 out of the last 8 sessions since the winner of the U.S. Presidential Election was announced.
The US Dollar Index $DXY has been adding fuel to the selling pressure as it has screamed higher toward the upper bound of a multi-year range.
However, the dollar is entering one of its weakest seasonal periods of the year and should start serving as a tailwind for our shiny rocks.
And if the dollar is about to roll over, our equal-weight basket of precious metal stocks will likely resolve its multi-decade base and make new all-time highs:
It wasn't clear how the price would react to our target, but sure enough, the sellers showed up right on cue.
But the weight of the evidence continues to suggest this bull market has legs and it's better to spend our time looking for buying opportunities, not selling opportunities.
Let's talk about the recent price action and what it means for our portfolios:
But what about the other alternative energy equities?
Solar stocks have been amongst the most hated in the entire market, right up there with pot stocks and China.
The Invesco Solar ETF $TAN looks ready to explode higher:
The fund is a market-cap-weighted basket of solar stocks from all around the world.
One of our favorite long-term momentum indicators, the monthly percentage price oscillator (PPO), has been improving for months and is on the verge of triggering a buy signal.
In addition, TAN has carved out a short term reversal pattern. An upside resolution will coincide with a monthly PPO cross, and we want to look for opportunities to buy the best stocks in the industry.
On a relative basis, TAN is at a critical level of interest versus the S&P 500:
This level represents where it began to outperform the broader market in the past.
Adding to our conviction, the 14-week RSI has carved out...
We all know it has been a bull market, but how sustainable is it?
In today's Gold Rush video, we addressed the elephant in the room. Is this a bubble?
Additionally, we revisited some of the greatest bubbles of all-time and tied it back to the current environment.
One of our favorite historic bubble examples is silver in the late 1970s:
The Hunt brothers controlled around 1/2 of the world's supply of silver and sparked a 900% rally over the course of 2-years. Over the next few years, silver retraced the entire preceding move as it collapsed by 90%.
Finally, we discussed a few strategies for riding a bubble higher and profiting from all the madness.