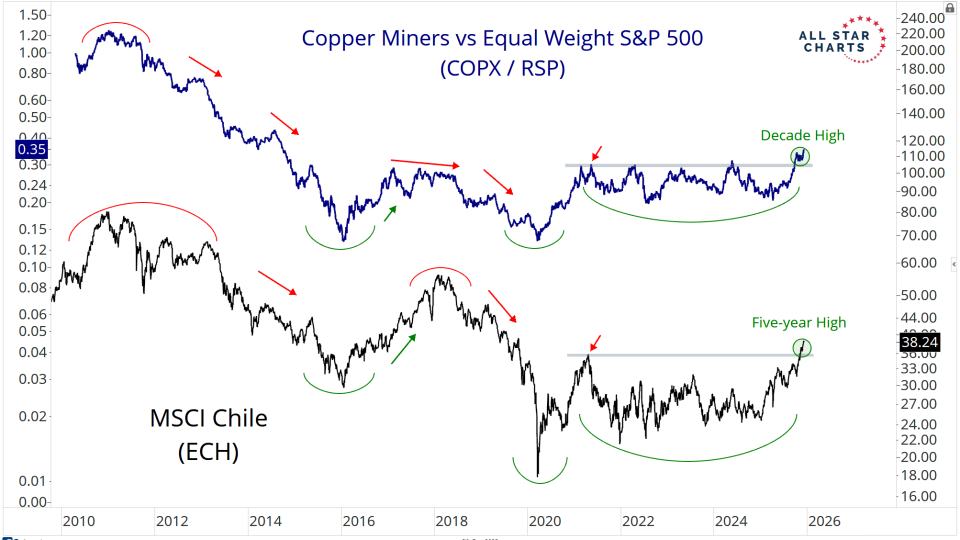
Base metals are entering a brand-new primary uptrend.
This entire year, we’ve been pounding the table on one idea: investors are wildly underestimating the structural shift unfolding inside base and industrial metals.
“Ending is better than mending.” — Aldous Huxley, Brave New World
Huxley wasn’t talking about the Federal Reserve, but he may as well have been.We’ve entered a market regime where policymakers would rather pump, patch,...
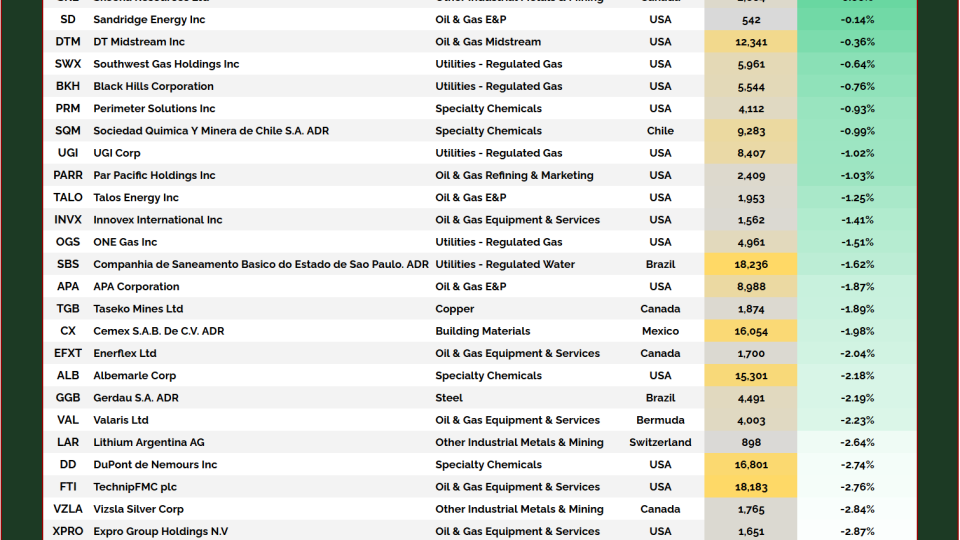
Most natural resource stocks, even the bellwethers of Metals or Energy, for example, can’t scale to $3 Trillion in market cap. They’re simply not built like the juggernauts of tech or communications.
There comes a moment in every long, grinding bear market when the selling exhausts itself and nobody cares anymore. The last marginal seller has finally thrown in the towel.
And when an entire corner of the commodity market gets left for dead,...
Most natural resource stocks, even the bellwethers of Metals or Energy, for example, can’t scale to $3 Trillion in market cap. They’re simply not built like the juggernauts of tech or communications.
“These are the times that try men’s souls. The summer soldier and the sunshine patriot will, in this crisis, shrink from the service of their country…”— Thomas Paine, 1776
It’s one of my favorite lines in all of literature — and one of...
Most natural resource stocks, even the bellwethers of Metals or Energy, for example, can’t scale to $3 Trillion in market cap. They’re not those types of companies - they’re just not built like the...