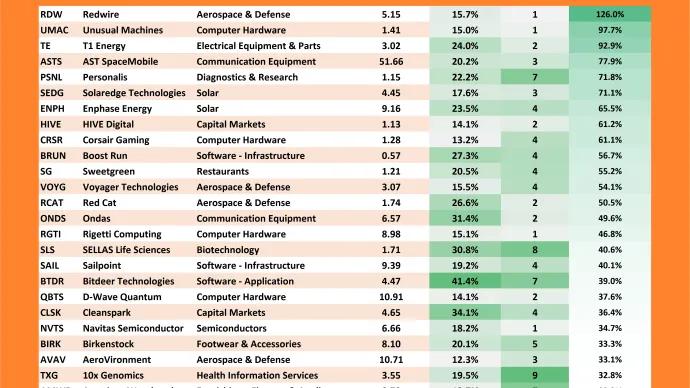
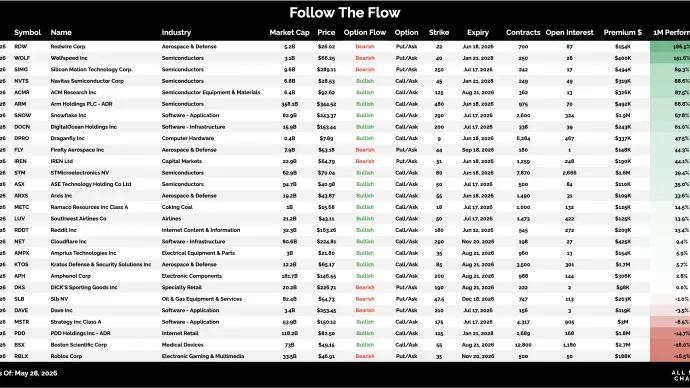
The market's biggest winners continue to come from the most crowded bearish bets.
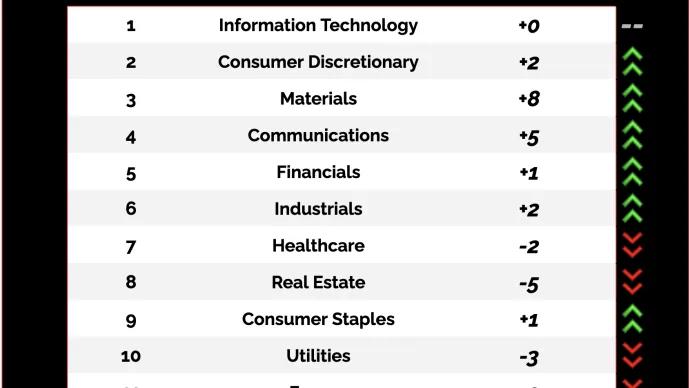
Stocks continue to print new highs across the board, and they're doing it with authority.
The S&P 500, Nasdaq 100, Dow Jones Industrials, and Russell 2000 are all pushing higher in unison as buyers continue to take control of this market....
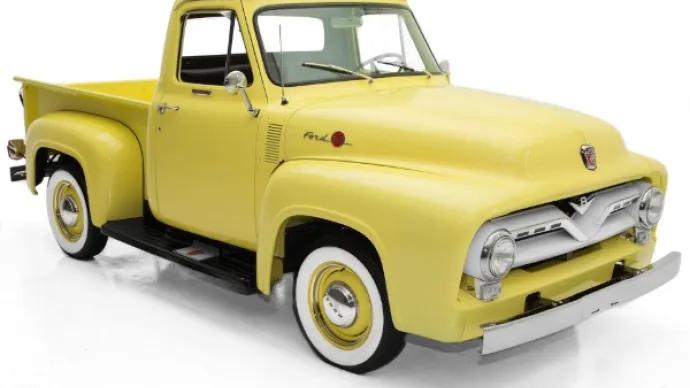
When I was a teenager in the 1990's, an older friend of a friend owned a hot day-glow yellow Ford truck. I don't remember what model it was, but it was some kind of suped- up classic. It looked something like this:...